


Ages of people at a park. Which situation is shown on this number line?
Graph of an ineq...

Mathematics, 27.03.2020 21:01, fortnite83
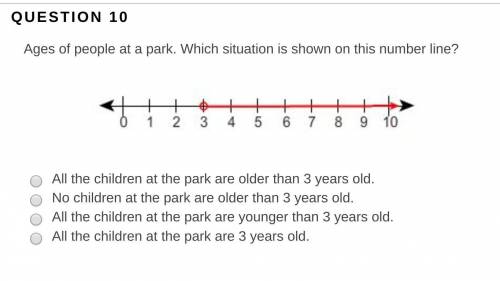
Ages of people at a park. Which situation is shown on this number line?
Graph of an inequality from positive 3 and all values to the right on a number line. Positive 3 is not included.
All the children at the park are older than 3 years old.
No children at the park are older than 3 years old.
All the children at the park are younger than 3 years old.
All the children at the park are 3 years old.

Answers: 2
Other questions on the subject: Mathematics
Mathematics, 22.06.2019 01:30, alliemeade1
Jon’s weight loss for each week of the month is 5 lbs., 2.5 lbs., and 2.5 lbs. he gained 3.5 lbs. the last week. if jon originally weighed 198 lbs., how much does he weigh now?
Answers: 1
Mathematics, 22.06.2019 02:30, montgomerykarloxc24x
Which number completes the system of linear inequalities represented by the graph? y > 2x – 2 and x + 4y >
Answers: 1
Mathematics, 22.06.2019 03:00, magemenproduct
The slope of the line whose equation is 2x - 1 = 0 is
Answers: 1
Do you know the correct answer?
Questions in other subjects:

English, 05.10.2020 01:01
Mathematics, 05.10.2020 01:01

History, 05.10.2020 01:01
Mathematics, 05.10.2020 01:01

World Languages, 05.10.2020 01:01


Arts, 05.10.2020 01:01
Mathematics, 05.10.2020 01:01


