

Mathematics, 27.03.2020 08:37, lavorisjonesjr1
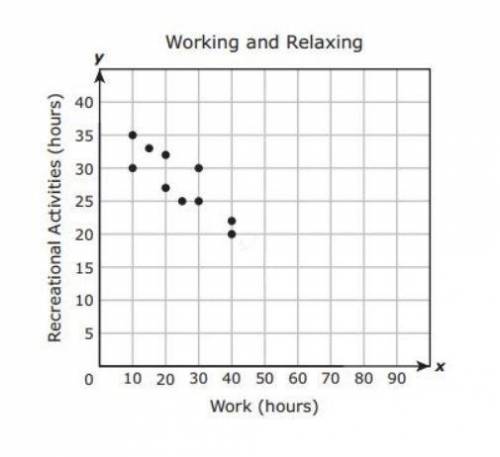
(Please!) The scatterplot shows the average number of hours each of 10 people spends at work every week and the average number of hours each of them spends on recreational activities every week.
Based on the scatterplot, what is the best prediction of the average number of hours a person spends on recreational activities every week if that person spends an average of 50 hours at work every week?
A) 10
B) 12
C) 18
D) 24

Answers: 2


Other questions on the subject: Mathematics
Mathematics, 21.06.2019 19:30, kataldaine
Which of the following describes the symmetry of the graph of y = x3?
Answers: 2
Do you know the correct answer?
(Please!) The scatterplot shows the average number of hours each of 10 people spends at work every w...
Questions in other subjects:


Physics, 24.05.2021 20:50
Mathematics, 24.05.2021 20:50

English, 24.05.2021 20:50


Biology, 24.05.2021 20:50


