


The following data set represents survey results on a scale of 1 to 10.
{4, 5, 7, 6, 4,...

Mathematics, 26.03.2020 02:53, yselahernandez02
The following data set represents survey results on a scale of 1 to 10.
{4, 5, 7, 6, 4, 4, 5, 4, 6, 5}
Based on this data set, which of the following responses would be most likely given by the next person surveyed?
A
6
B
9
C
2
D
10

Answers: 1
Other questions on the subject: Mathematics
Mathematics, 21.06.2019 18:30, wiredq2049
Ill mark the brainliest if you me with the these three questions 7,8,9
Answers: 2
Mathematics, 21.06.2019 18:30, Kelseyyleigh2611
Haruka hiked several kilometers in the morning. she hiked only 66 kilometers in the afternoon, which was 25% less than she had hiked in the morning. how many kilometers did haruka hike in all?
Answers: 3
Mathematics, 21.06.2019 19:30, BaileyElizabethRay
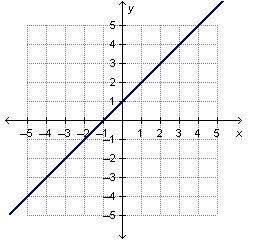
Which graph represents the equation y =4x
Answers: 1
Mathematics, 21.06.2019 19:40, kms275
The cross-sectional areas of a right triangular prism and a right cylinder are congruent. the right triangular prism has a height of 6 units, and the right cylinder has a height of 6 units. which conclusion can be made from the given information? the volume of the triangular prism is half the volume of the cylinder. the volume of the triangular prism is twice the volume of the cylinder. the volume of the triangular prism is equal to the volume of the cylinder. the volume of the triangular prism is not equal to the volume of the cylinder.
Answers: 1
Do you know the correct answer?
Questions in other subjects:


Chemistry, 30.11.2020 22:00


