

Mathematics, 24.03.2020 02:29, jorell
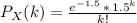
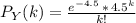
2. At the test center giving the exam from the previous problem, the firm needs to plan for proper staffing. Historical data suggests that the average number of applicants arriving per 20-minute period is 1.5. a. What is the best distribution to represent the number of applicant arrivals per 20-minute period? b. If five or more applicants arrive during an hour, the testing center needs to add one more staff member for that hour to proctor and evaluate exams. If the test center operates 50 hours per week, during how many of those 50 hours do we expect to need the extra staff member?

Answers: 1


Other questions on the subject: Mathematics
Mathematics, 21.06.2019 20:20, jackiediaz
One of every 20 customers reports poor customer service on your company’s customer satisfaction survey. you have just created a new process that should cut the number of poor customer service complaints in half. what percentage of customers would you expect to report poor service after this process is implemented? 1.) 5% 2.) 10% 3.) 2% 4.) 2.5%
Answers: 1
Mathematics, 21.06.2019 22:30, fredvales19
What fraction is equivalent to 0.46464646··· a. 46⁄99 b. 46⁄999 c. 46⁄100 d. 23⁄50
Answers: 1
Mathematics, 21.06.2019 23:10, ineedhelp2285
The input to the function is x and the output is y. write the function such that x can be a vector (use element-by-element operations). a) use the function to calculate y(-1.5) and y(5). b) use the function to make a plot of the function y(x) for -2 ≤ x ≤ 6.
Answers: 1
Mathematics, 21.06.2019 23:30, claytonhopkins
In a study of the relationship between socio-economic class and unethical behavior, 129 university of california undergraduates at berkeley were asked to identify themselves as having low or high social-class by comparing themselves to others with the most (least) money, most (least) education, and most (least) respected jobs. they were also presented with a jar of individually wrapped candies and informed that the candies were for children in a nearby laboratory, but that they could take some if they wanted. after completing some unrelated tasks, participants reported the number of candies they had taken. it was found that those who were identiď¬ed as upper-class took more candy than others. in this study, identify: (a) the cases, (b) the variables and their types, (c) the main research question, (d) identify the population of interest and the sample in this study, and (e) comment on whether or not the results of the study can be generalized to the population, and if the ď¬ndings of the study can be used to establish causal relationships.
Answers: 2
Do you know the correct answer?
2. At the test center giving the exam from the previous problem, the firm needs to plan for proper s...
Questions in other subjects:

Mathematics, 07.04.2021 21:10

English, 07.04.2021 21:10

World Languages, 07.04.2021 21:10
English, 07.04.2021 21:10
Mathematics, 07.04.2021 21:10


