

Mathematics, 24.03.2020 01:37, qveenjordan6456
Uma makes a scale drawing of a patio. The drawing below shows the two scales she used to plan two patios of different sizes.
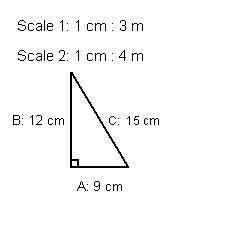
Scale 1: 1 centimeter = 3 meters. Scale 2: 1 centimeters = 4 meters. Triangle A B C. Side A is 9 centimeters, side B is 12 centimeters, and side C is 15 centimeters.
Which shows the correct lengths of side C in both scales?
Scale 1: 45 m; Scale 2: 60 m
Scale 1: 60 m; Scale 2: 45 m
Scale 1: 36 m; Scale 2: 27 m
Scale 1: 27 m; Scale 2: 36 m
help
then
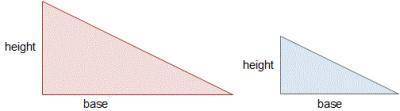
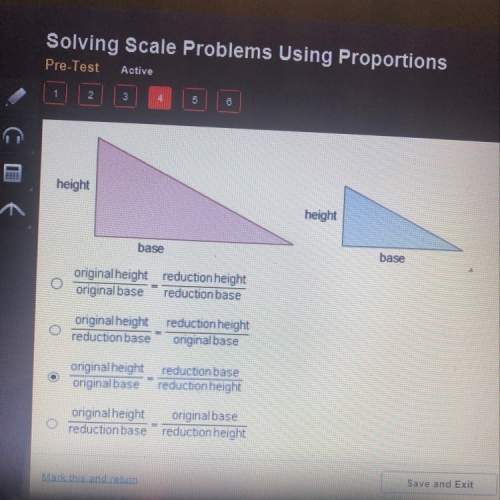
Which is the scale factor proportion for the reduction shown?
then
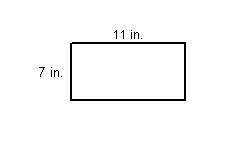
Sienna planned a rectangular pool, as shown in the scale drawing below.
A rectangle with length 11 inches and width 7 inches.
She decides to change the length, the longer side of the pool, from 22 ft to 27.5 ft. Which expression finds the change in the scale factor?

Answers: 2


Other questions on the subject: Mathematics
Mathematics, 21.06.2019 17:30, christinaaaat
Janet drove 300 miles in 4.5 hours. write an equation to find the rate at which she was traveling
Answers: 2
Mathematics, 21.06.2019 19:30, tiwaribianca475
Cor d? ? me ? max recorded the heights of 500 male humans. he found that the heights were normally distributed around a mean of 177 centimeters. which statements about max’s data must be true? a) the median of max’s data is 250 b) more than half of the data points max recorded were 177 centimeters. c) a data point chosen at random is as likely to be above the mean as it is to be below the mean. d) every height within three standard deviations of the mean is equally likely to be chosen if a data point is selected at random.
Answers: 1
Mathematics, 21.06.2019 22:30, rachelsweeney10
Determine domain and range, largest open interval, and intervals which function is continuous.
Answers: 2
Do you know the correct answer?
Uma makes a scale drawing of a patio. The drawing below shows the two scales she used to plan two pa...
Questions in other subjects:

Mathematics, 06.04.2021 20:10
Mathematics, 06.04.2021 20:10


Biology, 06.04.2021 20:10
Mathematics, 06.04.2021 20:10


