

Mathematics, 23.03.2020 23:06, jjhagan22
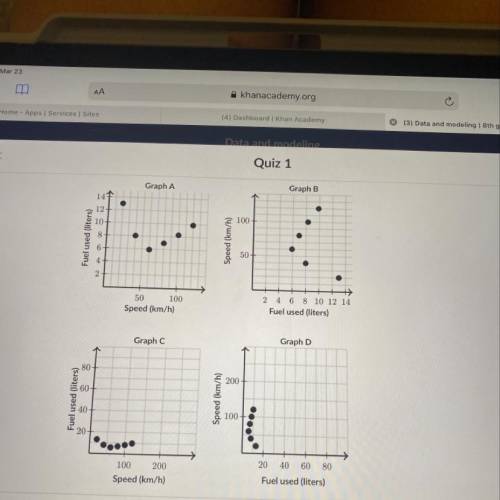
All of the scatter plots below display the data correctly, but which one of them displays the data best?
By convention, a good scatter plot uses a reasonable scale on both axes and puts the explanatory variable on the
L-axis.

Answers: 3


Other questions on the subject: Mathematics
Mathematics, 21.06.2019 12:30, mparra4761
Arandom sample of 240 park users were asked if they go to the park more often on weekdays or on the weekend. the results are shown in the table. weekdays weekend male 50 10 female 150 30 based on the data in the table, select correct or incorrect for each statement. correct incorrect the males go to the park more often on the weekend. the females go to the park more often on weekdays. for the participants in the survey, gender affects which days of the week a person goes to the park.
Answers: 1
Mathematics, 21.06.2019 16:40, shikiaanthony
You have 3 boxes, one "strawberries"; one "mentos" and one "mixed".but you know that all the labels are in incorrect order .how do you know witch is witch?
Answers: 1
Do you know the correct answer?
All of the scatter plots below display the data correctly, but which one of them displays the data b...
Questions in other subjects:
Mathematics, 26.02.2020 06:22
Mathematics, 26.02.2020 06:23

Biology, 26.02.2020 06:23
Mathematics, 26.02.2020 06:23
Mathematics, 26.02.2020 06:23
Mathematics, 26.02.2020 06:23
Mathematics, 26.02.2020 06:23


