

Mathematics, 23.03.2020 22:56, u8p4
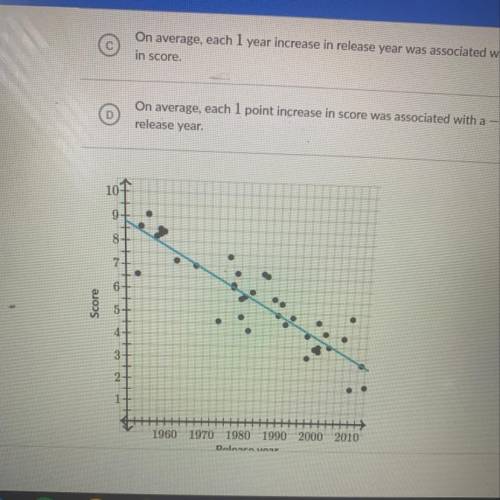
Surya gave each member of his family a different playlist of random songs to listen to and asked them to
rank each song between 0 and 10. He compared his family's rankings with the release year of each song
and created the following scatterplot and regression line.
The fitted line has a slope of -0.096.
What is the best interpretation of this slope?
Choose 1
A song released in 1950 would have a rating of about 8.75.
(B)
A song released in 1950 would have a rating of -0.096.
On average, each 1 year increase in release year was associated with a -0.096 point change
in score.
On average, each 1 point increase in score was associated with a -0.096 year change in
release year.

Answers: 2


Other questions on the subject: Mathematics
Mathematics, 21.06.2019 16:00, hailee6053
Choose the correct slope of the line that passes through the points (1, -3) and (3, -5)
Answers: 3
Mathematics, 21.06.2019 16:10, DepressionCentral
Which of the following graphs represents the function f(x) = 2^x
Answers: 2
Do you know the correct answer?
Surya gave each member of his family a different playlist of random songs to listen to and asked the...
Questions in other subjects:

Spanish, 23.07.2019 05:30

History, 23.07.2019 05:30

Biology, 23.07.2019 05:30

Mathematics, 23.07.2019 05:30

History, 23.07.2019 05:30


