

Mathematics, 23.03.2020 18:31, elliehemms6324
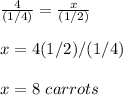
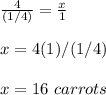
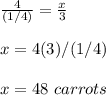
Do przygotowania ćwierć litra soku potrzebne są 4 marchewki. Ile marchewek potrzeba żeby otrzymać pół litra soku, litr soku, 2litry soku, 3litry soku

Answers: 3


Other questions on the subject: Mathematics
Mathematics, 21.06.2019 19:00, carterkelley12oz0kp1
This task builds on important concepts you've learned in this unit and allows you to apply those concepts to a variety of situations. the task has several parts, each in its own section. mr. hill's seventh grade math class has been learning about random sampling and how it tends to produce samples that are representative of an entire population. they've also learned that if a sample is representative of the entire population, then estimates or predictions made based on the sample usually apply to the population as well. today, in class, they are also learning about variation in random sampling. that, although predictions and estimates about the population can be made from a random sample, different random samples will often produce slightly different predictions or estimates. to demonstrate this concept to his students, mr. hill is going to use simulation. he begins the lesson by explaining to the class that a certain university in the united states has a student enrollment of 19,100. mr. hill knows the percentage of students that are male and the percentage of students that are female. using simulation and random sampling, he wants his seventh grade students to estimate both the percentage of male students and the number of male students that are enrolled in this university. to conduct the simulation, mr. hill has placed one hundred colored chips in a bag, using the appropriate percentages of enrolled male and female university students. red chips represent males, and yellow chips represent females. each seventh grade student will randomly select twenty chips, record the colors they selected, and put the chips back in the bag. at this point, each seventh grade student will only know the results of their own random sample. before you begin, it's a good idea to look over each part to get oriented to the whole task. additionally, it's best to complete the sections in order, since they build on each other. finally, the work you complete will be a combination of computer-graded problems and written work that your teacher will grade. in some cases, you will need to complete work outside of the problem (in a word processing document or on paper, for example) and upload it for grading. to get started click work on questions. questions: 1. suppose a student reaches in the bag and randomly selects nine red chips and eleven yellow chips. based on this sample, what is a good estimate for the percentage of enrolled university students that are male? 2. suppose a student reaches in the bag and randomly selects nine red chips and eleven yellow chips. based on this sample, what is a good estimate for the number of enrolled university students that are male? 3. suppose a different student reaches in the bag, randomly selects their twenty chips, and estimates that 60% of the students are male. how many yellow chips were in their sample? 4. suppose a different student reaches in the bag, randomly selects their twenty chips, and estimates that 60% of the students are male. based on this sample, what is a good estimate for the number of enrolled university students that are female? 5. based on your dot plot, make a new estimate of both the percentage and number of males that attend this university. use complete sentences in your answer and explain your reasoning. 6. compare your estimates for the percentage of male university students from part a and part b. which estimate do you think is more representative of the population? use complete sentences in your answer and explain your reasoning. 7. once you have created both sets of numbers, complete the following tasks. in each task, make sure to clearly label which set you are identifying or describing. identify the elements of each set that you created. calculate the mean of each set. show your work in your answer. calculate the mean absolute deviation of each set. show your work in your answer. describe the process you used to create your sets of numbers under the given conditions.
Answers: 1
Mathematics, 21.06.2019 22:00, zurfluhe
Manuela claims that and are congruent. which statement best describes her claim? she is incorrect because the segments do not have the same orientation. she is incorrect because the segments do not have the same length. she is correct because the segments have the same length. she is correct because the segments have the same orientation.
Answers: 1
Mathematics, 21.06.2019 22:10, Kurlyash
Atype of plant is introduced into an ecosystem and quickly begins to take over. a scientist counts the number of plants after mmonths and develops the equation p(m)= 19.3(1.089)^m to model the situation. most recently, the scientist counted 138 plants. assuming there are no limiting factors to the growth of the plants, about how many months have passed since the plants werefirst introduced? a)o 6.1b)0.6.6c)10 72d)o 23.1
Answers: 3
Mathematics, 21.06.2019 22:30, jaydenrenee111902
The volume of the sun is approximately 1 × 10^18 cu km, while the volume of jupiter is approximately 1 × 10^15 cu km. which of the following is true? a. the volume of jupiter is approximately one thousand times the volume of the sun. b. the volume of jupiter is approximately one hundred times the volume of the sun. c. the volume of the sun is approximately one thousand times the volume of jupiter. d. the volume of the sun is approximately one hundred times the volume of jupiter.
Answers: 2
Do you know the correct answer?
Do przygotowania ćwierć litra soku potrzebne są 4 marchewki. Ile marchewek potrzeba żeby otrzymać pó...
Questions in other subjects:
Mathematics, 24.01.2022 17:40
Mathematics, 24.01.2022 17:40

English, 24.01.2022 17:40

Physics, 24.01.2022 17:40
Mathematics, 24.01.2022 17:40
English, 24.01.2022 17:40
Mathematics, 24.01.2022 17:50

Computers and Technology, 24.01.2022 17:50


