
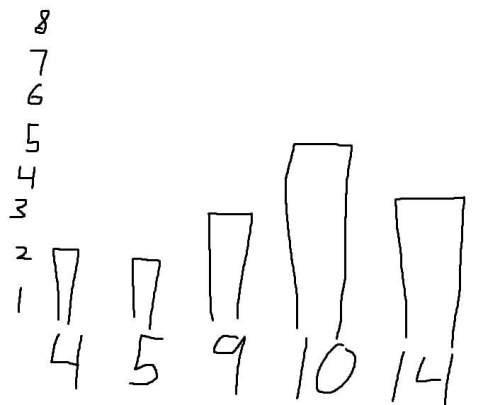


Which data set could be represented by the box plot shown below?
A horizontal boxplot is plott...

Mathematics, 21.03.2020 05:21, aesthetickait
Which data set could be represented by the box plot shown below?
A horizontal boxplot is plotted along a horizontal axis marked from 0 to 16, in increments of 1. A left whisker extends from 4 to 7. The box extends from 7 to 12 and is divided into 2 parts by a vertical line segment at 9. The right whisker extends from 12 to 14. All values estimated.

Answers: 2
Other questions on the subject: Mathematics
Mathematics, 21.06.2019 23:00, serenityburke
The areas of two similar triangles are 72dm2 and 50dm2. the sum of their perimeters is 226dm. what is the perimeter of each of these triangles?
Answers: 1
Do you know the correct answer?
Questions in other subjects:

Biology, 02.03.2021 18:10
Mathematics, 02.03.2021 18:10
Mathematics, 02.03.2021 18:10
Mathematics, 02.03.2021 18:10

History, 02.03.2021 18:10


