


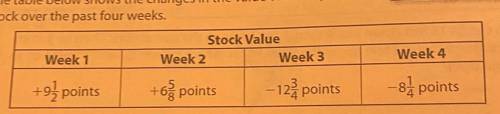
The table above shows the changes in the value of a company's stock over the past four weeks.
<...

Mathematics, 20.03.2020 21:10, pearlielb
The table above shows the changes in the value of a company's stock over the past four weeks.
1. A broker says that during the third week, the company's stock lost all of the points it had gained over the first two weeks. Is this claim correct? Explain.

Answers: 3
Other questions on the subject: Mathematics
Mathematics, 21.06.2019 23:00, jetblackcap
Perry observes the opposite parallel walls of a room in how many lines do the plains containing the walls intersect
Answers: 1
Mathematics, 21.06.2019 23:30, xxaurorabluexx
Pleting the square f the given find the x-intercepts of the parabola with vertex (-5,13) and y-intercept (0, 12). write your answer in this form: (14,.99). if necessary, round to the nearest hundredth. *- h enter the correct answer, de verter, and ametry 00000 done doo
Answers: 2
Do you know the correct answer?
Questions in other subjects:
Mathematics, 12.06.2020 20:57

Biology, 12.06.2020 20:57
Mathematics, 12.06.2020 20:57
Mathematics, 12.06.2020 20:57


Mathematics, 12.06.2020 20:57


History, 12.06.2020 20:57


