


1.
(06.01 MC)
The scatter plot shows the relationship between the test scores of a...

Mathematics, 20.03.2020 01:39, blackwell0315
1.
(06.01 MC)
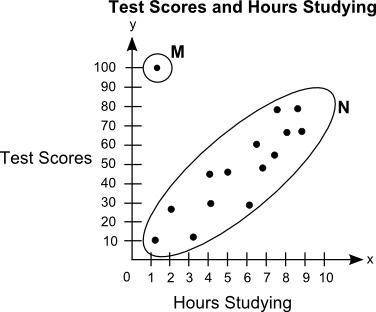
The scatter plot shows the relationship between the test scores of a group of students and the number of hours they study in a week:
On a grid, Label Hours Studying on x axis and Test Scores on y axis. The title of the graph is Test Scores and Hours Studying. The scale on the x axis shows the numbers from 0 to 10 at increments of 1, and the scale on the y axis shows numbers from 0 to 100 at increments of 10. Dots are made at the ordered pairs 1.1, 10 and 2, 25 and 3.1, 10.1 and 4, 30 and 4, 45 and 5, 45 and 6, 25 and 6.5, 60 and 7, 45 and 7.5, 50 and 7.5, 75 and 8, 60 and 8.5, 75 and 9, 60. The ordered pair 1, 100 is circled and labeled as M. All the other points are put in an oval and labeled as N.
Part A: What is the group of points labeled N called? What is the point labeled M called? Give a possible reason for the presence of point M. (5 points)
Part B: Describe the association between students' test scores and the number of hours they study. (5 points)

Answers: 3
Other questions on the subject: Mathematics
Mathematics, 21.06.2019 15:40, sciencecreation87
Sara needs to take a taxi to get to the movies the taxi charges $4.00 for the first mile and then $2.75 for each mile after that if the total charge is $20.50 then how far was sara’s taxi ride to the movie
Answers: 2
Mathematics, 21.06.2019 16:00, vjacksongonzalez
You eat 8 strawberries and your friend eats 12 strawberries from a bowl. there are 20 strawberries left. which equation and solution give the original number of strawberries?
Answers: 1
Mathematics, 21.06.2019 18:00, stephanielynch
Last year, a state university received 3,560 applications from boys. of those applications, 35 percent were from boys who lived in other states. part a)how many applications did the university receive from boys who lived in other states? part b)applications to the university from boys represented 40percent of all applications. how many applications did the university receive in all? i don't how to do part b so me and plz tell how you got your answer
Answers: 1
Do you know the correct answer?
Questions in other subjects:


Business, 03.12.2019 21:31
Mathematics, 03.12.2019 21:31

Mathematics, 03.12.2019 21:31


