

Mathematics, 19.03.2020 22:54, urieforlife
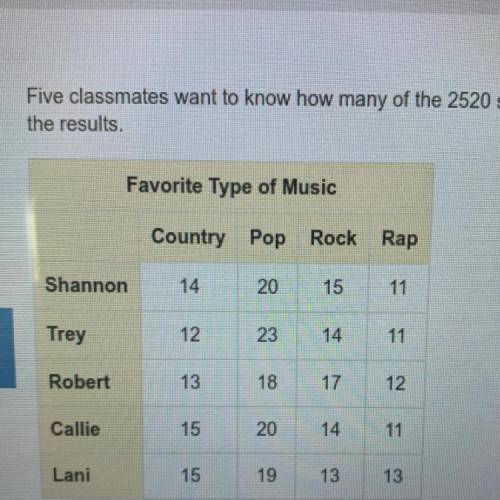
Five classmates want to know how many of the 2520 students in their school prefer pop music. They each randomly survey 60 students. The table shows the results.
Use the results from each classmate to make an inference about the number of students in the school who prefer pop music.
Based on Shannon’s results, the number is __ students.
Based on Trey’s results, the number is __ students.
Based on Robert’s results, the number is __ students.
Based on Callie’s results, the number is __ students.
Based on Lani’s results, the number is __ students.
Describe the variation of the five inferences. Which one would you use to describe the number of students at the school who prefer pop music? Explain.
The greatest is __ students. The least is __ students. The median of the data is __. The mode of the data is __. So use the inference of __ students to describe the number of students at the school who prefer pop music.

Answers: 2


Other questions on the subject: Mathematics
Mathematics, 21.06.2019 22:30, fluffpupkiki
5. (04.07)which of the following exponential functions goes through the points (1, 12) and (2, 36)? (2 points)f(x) = 3(4)^xf(x) = 4(3)^-xf(x) = 3(4)^-xf(x) = 4(3)^x
Answers: 1
Mathematics, 22.06.2019 00:00, Jasoncookies23
Awindow has the shape of a rectangle with a semi circle at the top. find the approximate area of the window using the dimensions shown. 4ft by 8ft
Answers: 1
Do you know the correct answer?
Five classmates want to know how many of the 2520 students in their school prefer pop music. They ea...
Questions in other subjects:


English, 04.06.2020 00:58
Mathematics, 04.06.2020 00:58

Physics, 04.06.2020 00:58
Mathematics, 04.06.2020 00:58
Mathematics, 04.06.2020 00:58

English, 04.06.2020 00:58
Mathematics, 04.06.2020 00:58


