


Which of the following best describes interval C on the graph shown?
A coordinate plane...

Mathematics, 19.03.2020 16:33, yakshp4098
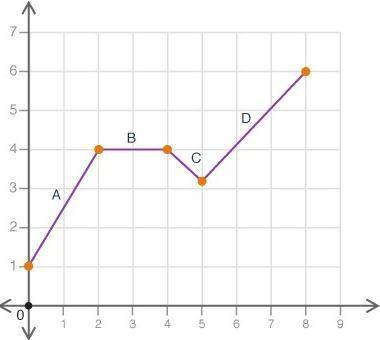
Which of the following best describes interval C on the graph shown?
A coordinate plane is shown. The line increases from x equals 0 to 2, then is horizontal from 2 to 4, decreases from 4 to 5, and then increases from 5 to 8.
Linear constant
Linear decreasing
Linear increasing
Nonlinear increasing

Answers: 2
Other questions on the subject: Mathematics
Do you know the correct answer?
Questions in other subjects:

Mathematics, 09.10.2019 10:00


Geography, 09.10.2019 10:00

Biology, 09.10.2019 10:00


