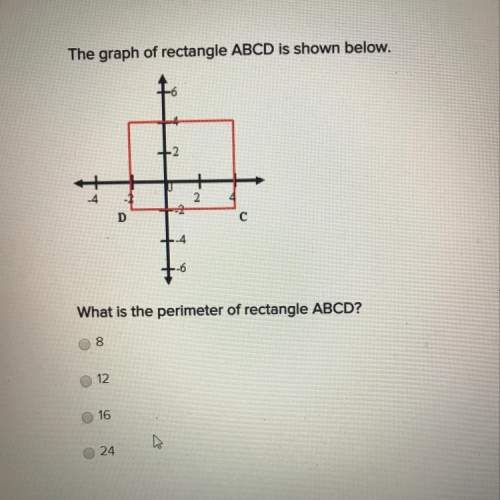
Question 1: Option D
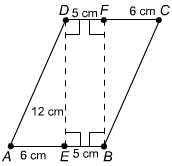
Area of the parallelogram = 132 cm²
Question 2: Option B
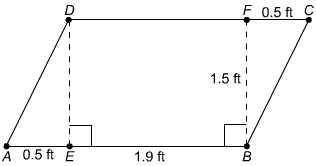
Area of the parallelogram = 3.60 ft²
Solution:
Question 1:
Base of the parallelogram = 6 + 5 = 11 cm
Height of the parallelogram = 12 cm
Area of the parallelogram = Base × Height
= 11 × 12
Area of the parallelogram = 132 cm²
Option D is the correct answer.
Question 2:
Base of the parallelogram = 1.9 + 0.5 = 2.4 ft
Height of the parallelogram = 1.5 ft
Area of the parallelogram = Base × Height
= 2.4 × 1.5
Area of the parallelogram = 3.60 ft²
Option B is the correct answer.