


The graph below shows the relationship between two variables.
Which scenario is best re...

Mathematics, 13.03.2020 23:58, thunder42
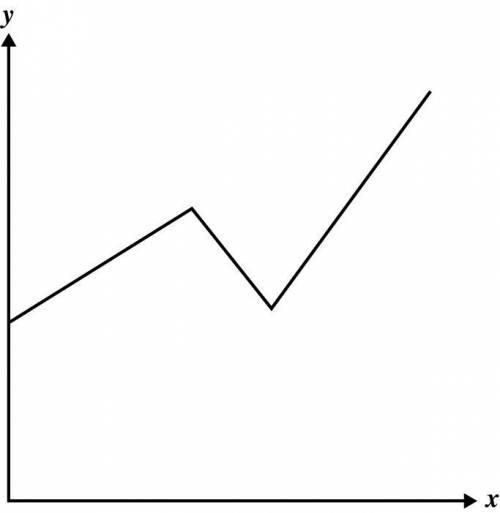
The graph below shows the relationship between two variables.
Which scenario is best represented by the graph?
David drove at a constant speed before slowing down in a school zone. He then increased the speed of his car.
The number of perfect test scores by students in a math class increased from the first to the second grading period and then began to decline.
After a period of slow growth, the height of a plant remained the same for 2 weeks. It was then fertilized and began to rapidly increase in height.
The number of employees at a store increased at a constant rate for 5 years. There was a decrease in the number of employees for 2 years. Then the number of employees increased at a greater constant rate for the next few years.

Answers: 3
Other questions on the subject: Mathematics
Mathematics, 21.06.2019 19:30, Pen350
Joel wants to buy a new tablet computer fram a store having a 20% off sale on all tablets. the tablet he wants has an original cost of $190. he also wants to make sure he has enough money to pay the 5% sales tax. part one joel uses the incorect expression 0.95(190)(0.8) to calculate that the tablet will cost him a total of $144.40. describe his error and write the correct expression part two how much will joel pay for the tablet show your work if you answer this question correctly you will receive a prize of 99 points good luck
Answers: 2
Mathematics, 22.06.2019 00:30, cassidyhead27
A10 inch cookie cake is divided into 8 slices. what is the area of 3 slices
Answers: 1
Do you know the correct answer?
Questions in other subjects:


Mathematics, 22.05.2020 22:59
Mathematics, 22.05.2020 22:59


