Mathematics, 13.03.2020 22:04, jamaicalove2880
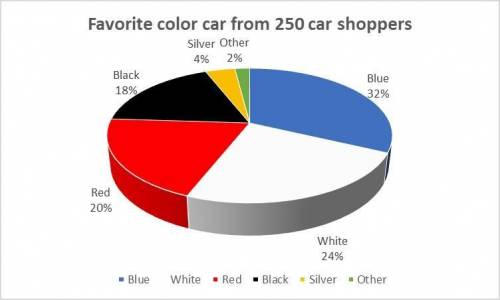
1. A researcher collected data from car shoppers about their favorite car color. He asked 250 people about their favorite vehicle color and the survey revealed the following: 32% said blue, 24% said white, 20% said red, 18% said black, and 4% said silver.
(a) What percent preferred a color other than blue, white, red, black, or silver?
(3 pts: 2 for answer, 1 for showing work)
(b) How many more people said their favorite color is white compared to those who said black? (3 pts – 2 for answer, 1 for showing work)
(c) Draw and label a circle graph showing the responses to the survey. Be sure to include a section for “Other”. Be sure your circle graph is labeled, and the percentages are in proportion to the whole. (2 pts – 1 for correctly showing percentages and 1 for labeling)

Answers: 2
Other questions on the subject: Mathematics

Mathematics, 21.06.2019 15:00, Chanman40025
The triangles are similar. what is the value of x? show your work.
Answers: 2

Mathematics, 21.06.2019 16:00, loyaltyandgood
Which segments are congruent? o jn and ln o jn and nm o in and nk onk and nm
Answers: 3

Mathematics, 21.06.2019 16:00, yurimontoya759
12. the amount of money in a bank account decreased by 21.5% over the last year. if the amount of money at the beginning of the year is represented by ‘n', write 3 equivalent expressions to represent the amount of money in the bank account after the decrease?
Answers: 2

Mathematics, 21.06.2019 19:30, vanessagallion
Evaluate 3(a + b + c)squared for a = 2, b = 3, and c = 4. a. 54 b. 243 c.729 add solution .
Answers: 1
Do you know the correct answer?
1. A researcher collected data from car shoppers about their favorite car color. He asked 250 people...
Questions in other subjects:

Biology, 30.10.2019 10:31

Arts, 30.10.2019 10:31


Mathematics, 30.10.2019 10:31

Mathematics, 30.10.2019 10:31

Mathematics, 30.10.2019 10:31

Mathematics, 30.10.2019 10:31


