


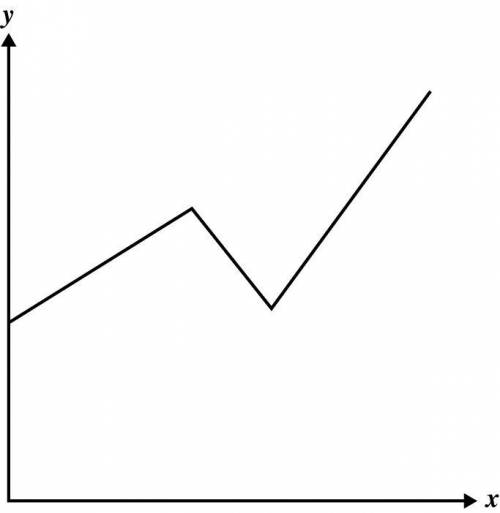
The graph below shows the relationship between two variables.
Which scenario is BEST rep...

Mathematics, 13.03.2020 05:01, stormserena
The graph below shows the relationship between two variables.
Which scenario is BEST represented by the graph?
David drove at a constant speed before slowing down in a school zone. He then increased the speed of his car.
The number of perfect test scores by students in a math class increased from the first to the second grading period and then began to decline.
After a period of slow growth, the height of a plant remained the same for 2 weeks. It was then fertilized and began to rapidly increase in height.
The number of employees at a store increased at a constant rate for 5 years. There was a decrease in the number of employees for 2 years. Then the number of employees increased at a greater constant rate for the next few years.

Answers: 1
Other questions on the subject: Mathematics
Mathematics, 21.06.2019 13:30, tylorwsimmons
Which transformations could have occurred to map △abc to △a"b"c"? a rotation and a reflection a translation and a dilation a reflection and a dilation a dilation and a rotation
Answers: 1
Mathematics, 21.06.2019 22:00, NetherisIsTheQueen
You can ride your bike around your block 6 times and the whole neighborhood 5 times in 16 minutes. you can ride your bike around your block 3 times and the whole neighborhood 10 times in 23 minutes. how long does it take you to ride around the neighborhood?
Answers: 2
Mathematics, 22.06.2019 01:10, 24nelsoaddh
If the probability of an event happening is 65% then the probability this event does not occur?
Answers: 1
Do you know the correct answer?
Questions in other subjects:


Mathematics, 07.03.2020 00:13


Mathematics, 07.03.2020 00:13


