


The graph below shows the relationship between two variables.
Which scenario is BEST rep...

Mathematics, 13.03.2020 01:03, macylen3900
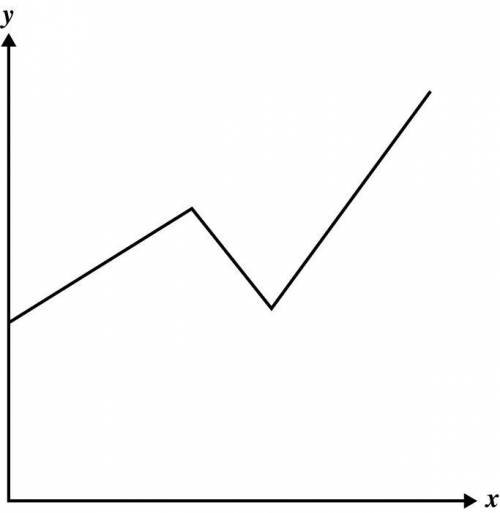
The graph below shows the relationship between two variables.
Which scenario is BEST represented by the graph?
David drove at a constant speed before slowing down in a school zone. He then increased the speed of his car.
The number of perfect test scores by students in a math class increased from the first to the second grading period and then began to decline.
After a period of slow growth, the height of a plant remained the same for 2 weeks. It was then fertilized and began to rapidly increase in height.
The number of employees at a store increased at a constant rate for 5 years. There was a decrease in the number of employees for 2 years. Then the number of employees increased at a greater constant rate for the next few years.

Answers: 2
Other questions on the subject: Mathematics
Mathematics, 21.06.2019 23:40, haybales6019
Cos^2x+cos^2(120°+x)+cos^2(120°-x)i need this asap. pls me
Answers: 1
Mathematics, 22.06.2019 01:00, dommalb
The dance committee of pine bluff middle school earns $72 from a bake sale and will earn $4 for each ticket they sell to the spring fling dance. the dance will cost $400 write an inequality to determine the number, t of tickets the committee could sell to have money left over after they pay for this year's dance. what is the solution set of the inequality?
Answers: 2
Do you know the correct answer?
Questions in other subjects:


Social Studies, 14.05.2021 02:30

Biology, 14.05.2021 02:30


Mathematics, 14.05.2021 02:30


