Mathematics, 10.03.2020 17:22, abraralzaher
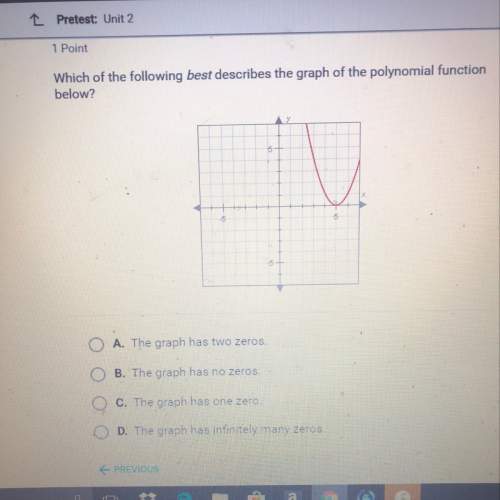
The table below represents the function f, and the following graph represents the function g.
x -6 -5 -4 -3 -2 -1 0 1
f(x) 8 -2 -8 -10 -8 -2 8 22
Complete the following statements.
The functions f and g have .
The y-intercept of f is the y-intercept of g.
Over the interval [-6, -3], the average rate of change of f is the average rate of change of g.

Answers: 3
Other questions on the subject: Mathematics

Mathematics, 21.06.2019 16:30, shyann78
In two or more complete sentences, formulate how to use technology to calculate the appropriate regression model for the given data. you are not required to find the model, just choose the appropriate regression and explain how to use the technology. (-5,,2.,0.8), (0,-0.5), (2,-1.3), (3,-0.8), (5,2)
Answers: 2


Do you know the correct answer?
The table below represents the function f, and the following graph represents the function g.
...
...
Questions in other subjects:

Chemistry, 01.10.2021 21:00

Computers and Technology, 01.10.2021 21:00

Physics, 01.10.2021 21:00


Physics, 01.10.2021 21:00

Social Studies, 01.10.2021 21:00


