

Mathematics, 10.03.2020 10:24, nook4boo
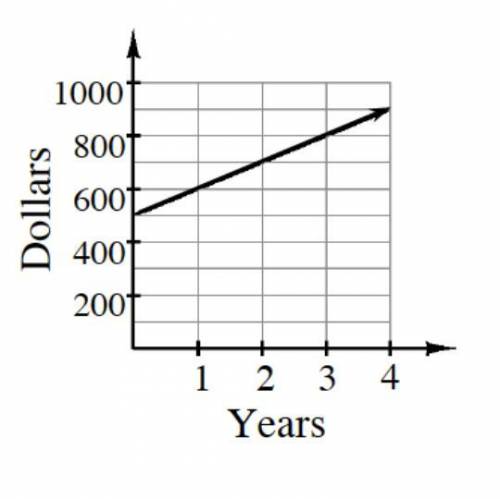
Your banker shows you the graph at right to explain what you can earn if you invest with him. Does this graph represent simple or compound interest? How can you tell? Write an equation to represent how much money you would have as time passes. Make sure you write a “let” statement.
graph of years by dollars?

Answers: 3


Other questions on the subject: Mathematics
Mathematics, 21.06.2019 21:10, verdolaga2017me
What is the domain of the given function? {(3,-2), (6, 1), (-1, 4), (5,9), (-4, 0); o {x | x= -4,-1, 3, 5, 6} o {yl y = -2,0, 1,4,9} o {x|x = -4,-2, -1,0, 1, 3, 4, 5, 6, 9} o y y = 4,-2, -1, 0, 1, 3, 4, 5, 6, 9}
Answers: 1
Mathematics, 21.06.2019 21:50, zymikaa00
Scores on a university exam are normally distributed with a mean of 78 and a standard deviation of 8. the professor teaching the class declares that a score of 70 or higher is required for a grade of at least “c.” using the 68-95-99.7 rule, what percentage of students failed to earn a grade of at least “c”?
Answers: 1
Do you know the correct answer?
Your banker shows you the graph at right to explain what you can earn if you invest with him. Does t...
Questions in other subjects:


