

Mathematics, 10.03.2020 07:39, irlShadow
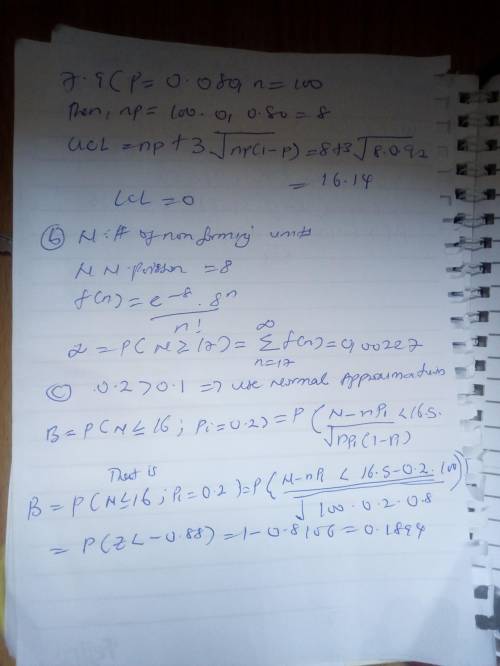
A process is controlled with a fraction nonconforming control chart with three-sigma limits, n = 100, UCL = 0.161, center line = 0.080, and LCL = 0.
a. Find the equivalent control chart for the number nonconforming.
b. Use the Poisson approximation to the binomial to find the probability of a type I error.
c. Use the normal approximation to binomial to find the probability of a type II error if the process fraction nonconforming shifts to 0.2.
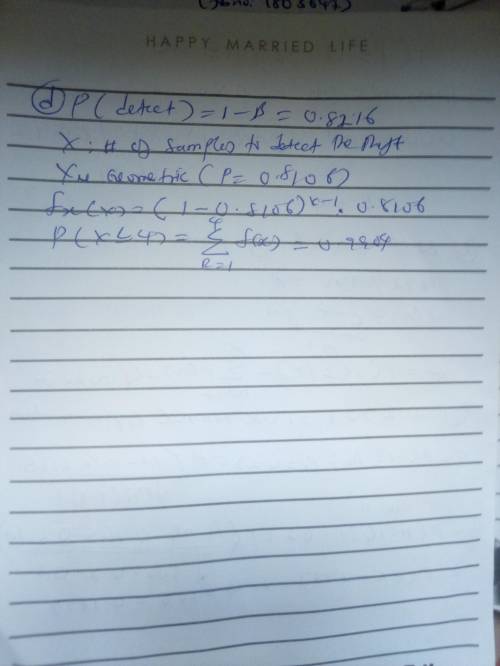
d. What is the probability of detecting the shift in part (c) by at most the fourth sample after the shift?

Answers: 2


Other questions on the subject: Mathematics
Mathematics, 21.06.2019 19:00, mustafajibawi1
Eis the midpoint of line segment ac and bd also line segment ed is congruent to ec prove that line segment ae is congruent to line segment be
Answers: 3
Mathematics, 21.06.2019 20:00, nauticatyson9
If private savings 'v' = 0.75s and total savings 's' equals $4.20 billion, solve for public and private savings.
Answers: 2
Do you know the correct answer?
A process is controlled with a fraction nonconforming control chart with three-sigma limits, n = 100...
Questions in other subjects:


History, 07.04.2020 20:58

Spanish, 07.04.2020 20:58


Mathematics, 07.04.2020 20:58


