

Mathematics, 10.03.2020 00:03, nikkiebartels
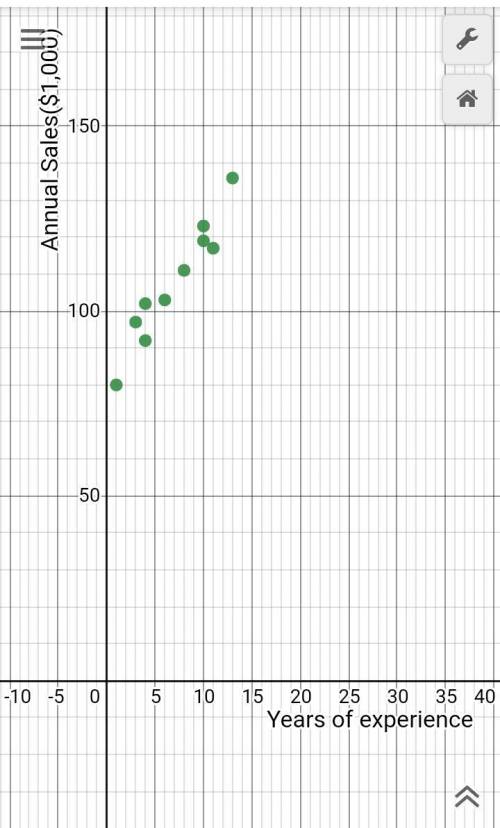
A sales manager collected the following data on annual sales for new customer accounts and the number of years of experience for a sample of salespersons.
Saleperson Year of experience Annual Sales ($1000)
1 1 80
2 3 97
3 4 92
4 4 102
5 6 103
6 8 111
7 10 119
8 10 123
9 11 117
10 13 136
a. Develop a scatter diagram for these data with years of experience as the independent variable.
b. Develop an estimated regression equation that can be used to predict annual sales given the years of experience.
c. Use the estimated regression equation to predict annual sales for a salesperson with 9 years of experience.

Answers: 1


Other questions on the subject: Mathematics
Mathematics, 21.06.2019 15:30, orlando19882000
You have 6 dollars +12 pennies +to quarters + 4 dimes=2 nickels how much do you have
Answers: 1
Mathematics, 21.06.2019 20:00, anthonybowie99
Write the point-slope form of the line passing through (2, -12) and parallel to y=3x.
Answers: 3
Mathematics, 21.06.2019 23:00, jjackson0010
If mary had 320 toy cars and she gave her friend 50 cars and then she gave her brother 72 more cars how much toy cars would mary have left ● explain with proper details
Answers: 1
Mathematics, 21.06.2019 23:50, tatibean26
The functions f(x) and g(x) are shown in the graph f(x)=x^2 what is g(x) ?
Answers: 2
Do you know the correct answer?
A sales manager collected the following data on annual sales for new customer accounts and the numbe...
Questions in other subjects:

Physics, 21.08.2019 12:10
Mathematics, 21.08.2019 12:10


History, 21.08.2019 12:10
Health, 21.08.2019 12:10

Social Studies, 21.08.2019 12:10

English, 21.08.2019 12:10


