

Mathematics, 09.03.2020 23:39, kirstennnash
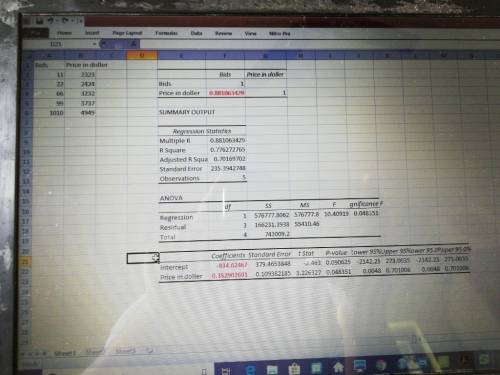
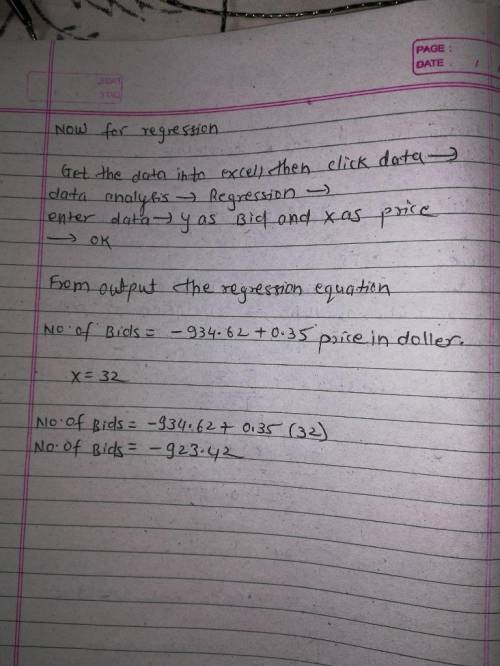
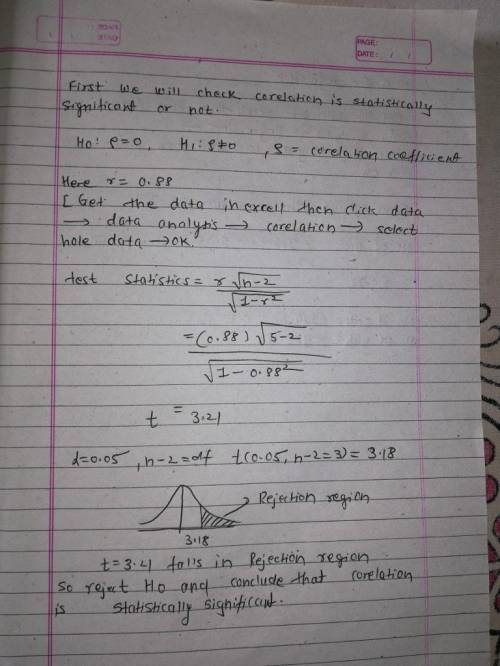
The table below gives the list price and the number of bids received for five randomly selected items sold through online auctions. Using this data, consider the equation of the regression line, yˆ=b0+b1x for predicting the number of bids an item will receive based on the list price. Keep in mind, the correlation coefficient may or may not be statistically significant for the data given. Remember, in practice, it would not be appropriate to use the regression line to make a prediction if the correlation coefficient is not statistically significant.
col1 Price in Dollars 23 24 32 37 49
col2 Number of Bids 1 2 6 9 10
Step 2 of 6: Find the estimated y-intercept =-0.488
Step 3 of 6: Determine the value of the dependent variable yˆ at x=0 is = -0.488
Step 4 of 6: Determine if the statement "Not all points predicted by the linear model fall on the same line" is False
Step 5 of 6: Substitute the values you found in steps 1 and 2 into the equation for the regression line to find the estimated linear model. According to this model, if the value of the independent variable is increased by one unit, then find the change in the dependent variable =0.290
Step 6 of 6: Find the value of the coefficient of determination =0.928

Answers: 3


Other questions on the subject: Mathematics
Mathematics, 21.06.2019 17:00, nataliemoore1974
Explain how you do each step what term makes it inconsistent y=2x - 4 ?
Answers: 1
Mathematics, 21.06.2019 18:30, gabrielaaaa1323
At the olympic games, many events have several rounds of competition. one of these events is the men's 100-meter backstroke. the upper dot plot shows the times (in seconds) of the top 8 finishers in the final round of the 2012 olympics. the lower dot plot shows the times of the same 8 swimmers, but in the semifinal round. which pieces of information can be gathered from these dot plots? (remember that lower swim times are faster.) choose all answers that apply: a: the swimmers had faster times on average in the final round. b: the times in the final round vary noticeably more than the times in the semifinal round. c: none of the above.
Answers: 2
Mathematics, 21.06.2019 20:30, meowmeowcow
Given: klmn is a parallelogram m? n=3m? k, lf ? kn , ld ? nm kf=2 cm, fn=4 cm find: lf, ld
Answers: 1
Do you know the correct answer?
The table below gives the list price and the number of bids received for five randomly selected item...
Questions in other subjects:

History, 21.08.2020 08:01


Social Studies, 21.08.2020 08:01


