
 (1.6 feet)

 is the period
 is the vertical shift
 is the phase shift


REALLY DESPERATE WILL REWARD BRAINLIEST
Throughout any given month, the maximum and minimum oc...

Mathematics, 09.03.2020 14:39, quanntwann2873
REALLY DESPERATE WILL REWARD BRAINLIEST
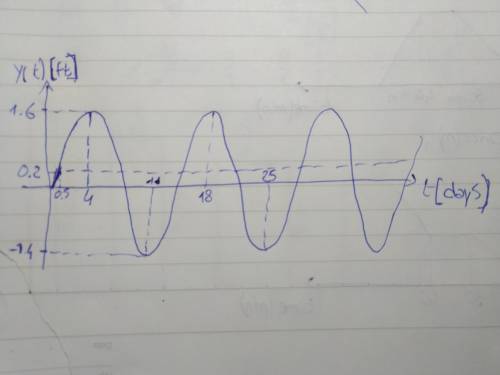
Throughout any given month, the maximum and minimum ocean tides follow a periodic pattern. Last year, at a certain location on the California coast, researchers recorded the height of low tide, with respect to sea level, each day during the month of July. The lowest low tide was first measured on July 11, at -1.4 feet. The highest low tide was first measured on July 4, at 1.8 feet. The average low tide for the month of July was measured to be 0.2 feet.
Part A
Why do the ocean tides follow a periodic pattern?
Part C
Which curve would you choose to model this function, sine or cosine? Give your reasons.
Part D
Find the amplitude of the function. Explain its meaning in the context.
Part E
Find the period of the function. Explain its meaning in the context.
Part F
Find the vertical shift of the function. Explain its meaning in the context.
Part G
Find the phase shift of the function. Explain its meaning in context.
Part H
Write the function for the curve from all of the key features you just found.
Part I
Graph the function.
Part J
What are the days of the month when the low tide is projected to be the average height? What do you suppose a decimal value for a day in the month means?
Part K
The actual low tide height recorded on a given day could vary from the function created as a model. Give some reasons for why you think this happens.

Answers: 1
Other questions on the subject: Mathematics
Do you know the correct answer?
Questions in other subjects:


Arts, 09.04.2020 05:18
History, 09.04.2020 05:18
Mathematics, 09.04.2020 05:19


