


 sales of trench coats increased 8.3 percentage points faster than total coat sales.
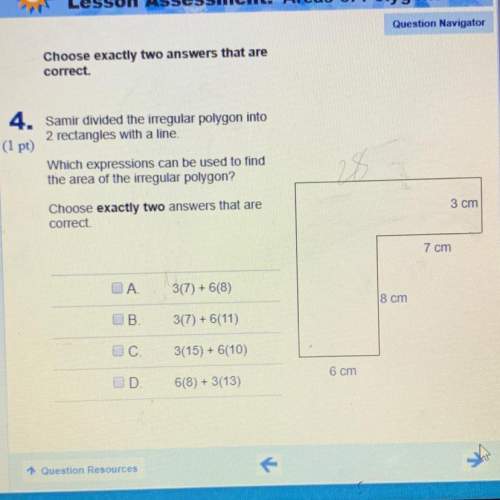


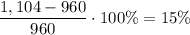
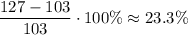
The following chart shows a store’s coat sales for two years.
2 circle graphs. A circle graph...

Mathematics, 09.03.2020 06:13, karlaperez7309
The following chart shows a store’s coat sales for two years.
2 circle graphs. A circle graph titled 2006. Top coats is 297, parkas is 210, jackets is 213, raincoats is 137, trench coats is 103. A circle graph titled 2007. Topcoats is 223, parkas is 210, jackets is 285, raincoats is 259, trench coats is 127.
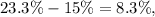
Identify the percent increase in total sales and the percent increase in sales of trench coats. Then find which percent of increase is greater and by how much greater it is than the other. (Round your answer to the nearest tenth.)
a.
Sales of trench coats increased 0.7 percentage points faster than total coat sales.
b.
Sales of trench coats increased 8.3 percentage points faster than total coat sales.
c.
Total coat sales increased 2.5 percentage points faster than sales of trench coats.
d.
Total coat sales increased 10.7 percentage points faster than sales of trench coats.

Answers: 2
Other questions on the subject: Mathematics
Mathematics, 21.06.2019 14:30, chintiffany4779
Describe in detail how you would construct a 95% confidence interval for a set of 30 data points whose mean is 20 and population standard deviation is 3. be sure to show that you know the formula and how to plug into it. also, clearly state the margin of error.
Answers: 3
Mathematics, 21.06.2019 20:00, demetriascott20
Write the point-slope form of the line passing through (2, -12) and parallel to y=3x.
Answers: 2
Mathematics, 21.06.2019 20:30, elyzeraganitowlkn9
What is the radius of a circle with an area of 78.5 cubic inches? use 3.14 for pie
Answers: 2
Mathematics, 21.06.2019 21:30, oliup567
(c) the diagram shows the first three shapes of a matchsticks arrangement. first shape = 3second shape = 5third shape = 7given m represents the number of matchstick used to arrange the n'th shape.(i) write a formula to represent the relation between m and n. express m as the subjectof the formula.(ii) 19 matchsticks are used to make the p'th shape. find the value of p.
Answers: 2
Do you know the correct answer?
Questions in other subjects:

History, 05.10.2019 07:30
Mathematics, 05.10.2019 07:30

English, 05.10.2019 07:30
Mathematics, 05.10.2019 07:30

History, 05.10.2019 07:30
History, 05.10.2019 07:30


