

Mathematics, 29.02.2020 04:26, 10121545
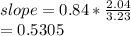
A pediatrician wishes to study how the average weight Y (in kilograms) of children changes during the first year of life. He plots these averages versus the age X (in months) and decides to fit a least-squares regression line to the data with X as the explanatory variable and Y as the response variable. He computes the following quantities: r = correlation between X and Y= 0.84 x = mean of the values of X = 5.69 y = mean of the values of Y = 6.26 S_x = standard deviation of the values of X = 3.23 s_y = standard deviation of the values of Y = 2.04 The slope of the least-squares line is: A) 0.53.B) 0.64. C) 0.84. D) 2.04.

Answers: 1


Other questions on the subject: Mathematics
Mathematics, 22.06.2019 04:00, AutumnJoy12
Order 1100000, 314000, 965000, 1890000, from least to greatest.
Answers: 1
Do you know the correct answer?
A pediatrician wishes to study how the average weight Y (in kilograms) of children changes during th...
Questions in other subjects:

Arts, 15.04.2021 23:10
Mathematics, 15.04.2021 23:10
Mathematics, 15.04.2021 23:10

Physics, 15.04.2021 23:10


