

Mathematics, 28.02.2020 22:51, osmanysalvador9
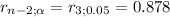
For the accompanying data set, draw a scatter diagram of the data. x 2 6 6 7 9y 3 2 6 9 5B. by hand compute the correlation coefficient. r = (round to three decimals as needed.)C. Fill in the blanks: Because the correlation coefficient is (positive or negative) and the absolute value of the correlation coefficient, , is (greater or not greater) than the critical value for this data set,___, (no, a positive, or a negative) linear relation exists between x and y. (round to three decimal places as needed.)Critical values for the correlation coefficient tablen 3 0.9974 0.9505 0.8786 0.8117 0.7548 0.7079 0.66610 0.63211 0.60212 0.57613 0.55314 0.53215 0.51416 0.49717 0.48218 0.46819 0.45620 0.44421 0.43322 0.42323 0.41324 0.40425 0.39626 0.38827 0.38128 0.37429 0.36730 0.361

Answers: 2
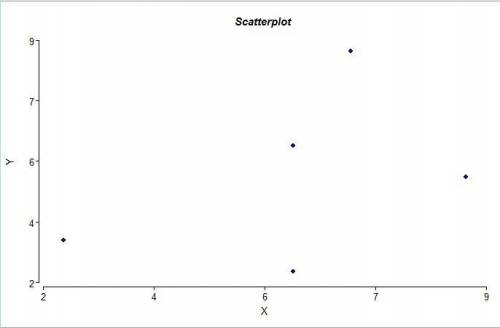
![r= \frac{sumXY-\frac{(sumX)(sumY)}{n} }{\sqrt{[sumX^2-\frac{(sumX)^2}{n} ][sumY^2-\frac{(sumY)^2}{n} ]} }](/tpl/images/0528/6572/d1180.png)
![r= \frac{162-\frac{(30)*(25)}{5} }{\sqrt{[206-\frac{(30)^2}{5} ][155-\frac{(25)^2}{5} ]} }](/tpl/images/0528/6572/6af60.png)


Other questions on the subject: Mathematics
Mathematics, 21.06.2019 15:30, hannahking1869
Which conjunction is disjunction is equivalent to the given absolute value inequality? |x+2|< 18
Answers: 1
Mathematics, 21.06.2019 17:20, mqturner1989Kedie
Select a graph that have an equation with a < 0
Answers: 2
Mathematics, 21.06.2019 17:30, bradleycawley02
Lems1. the following data set represents the scores on intelligence quotient(iq) examinations of 40 sixth-grade students at a particular school: 114, 122, 103, 118, 99, 105, 134, 125, 117, 106, 109, 104, 111, 127,133, 111, 117, 103, 120, 98, 100, 130, 141, 119, 128, 106, 109, 115,113, 121, 100, 130, 125, 117, 119, 113, 104, 108, 110, 102(a) present this data set in a frequency histogram.(b) which class interval contains the greatest number of data values? (c) is there a roughly equal number of data in each class interval? (d) does the histogram appear to be approximately symmetric? if so, about which interval is it approximately symmetric?
Answers: 3
Mathematics, 21.06.2019 18:00, Tellyy8104
On a piece of paper, graph y< x+1. then determine which answer matches the graph you drew.
Answers: 2
Do you know the correct answer?
For the accompanying data set, draw a scatter diagram of the data. x 2 6 6 7 9y 3 2 6 9 5B. by hand...
Questions in other subjects:


History, 05.05.2020 17:28

Mathematics, 05.05.2020 17:28


Social Studies, 05.05.2020 17:28
Social Studies, 05.05.2020 17:28
Mathematics, 05.05.2020 17:28


