

Mathematics, 27.02.2020 21:50, artursino
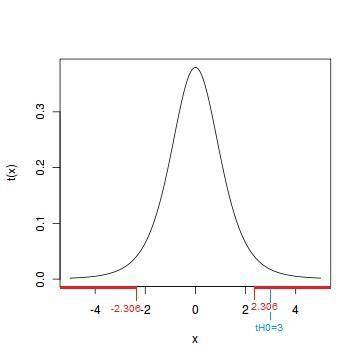
People tend to evaluate the quality of their lives relative to others around them (Frieswijk et al., 2004). In one study, researchers conducted interviews with n = 9 frail elderly people. During the interview, each person was compared with a fictitious person who was worse off than the elderly person. The scores below are the measures from a life-satisfaction scale for the elderly sample. Assume that the average score on this scale in the population is u = 20. Are the data sufficient to conclude that the elderly people in this sample are either significantly more or less satisfied than others in the general population? The life-satisfaction scores for the sample are 18, 23, 24, 22, 19, 27, 23, 26, 25. a. Which kind of t-test should you use? b. How many tails should the test have? Circle a word or phrase in the problem that told you this. c. State the null and alternative hypotheses in statistical notation: d. Determine the critical t using an alpha = .05. Sketch the null distribution, note the location of the critical t, and shade the critical region. e. Calculate the t-statistic and plot it on the sketch you drew above. f. Make a decision (either reject the null or fail to reject it)

Answers: 1


![t_{H_0}= \frac{X[bar]-Mu}{\frac{S}{\sqrt{n} } } ~t_{n-1}](/tpl/images/0527/1928/b1fb8.png)


Other questions on the subject: Mathematics
Mathematics, 21.06.2019 14:10, mbatton879
5500 dollars is placed in an account with an annual interest rate of 6.5%. to the nearest tenth of a year, how long will it take for the account value to reach 19700 dollars?
Answers: 2
Mathematics, 21.06.2019 16:00, lil8174
Which term best describes the association between variables a and b? no association a negative linear association a positive linear association a nonlinear association a scatterplot with an x axis labeled, variable a from zero to ten in increments of two and the y axis labeled, variable b from zero to one hundred forty in increments of twenty with fifteen points in a positive trend.
Answers: 3
Mathematics, 21.06.2019 19:30, valerieaj113
Weekly wages at a certain factory are normally distributed with a mean of $400 and a standard deviation of $50. find the probability that a worker selected at random makes between $450 and $500
Answers: 2
Mathematics, 21.06.2019 23:10, toricepeda82
In which quadrant does the point lie? write the coordinates of the point. a. quadrant ii; (–2, –4) b. quadrant iii; (2, 4) c. quadrant iii; (–2, –4) d. quadrant iv; (–4, –2)
Answers: 3
Do you know the correct answer?
People tend to evaluate the quality of their lives relative to others around them (Frieswijk et al.,...
Questions in other subjects:


Mathematics, 24.01.2020 00:31
Mathematics, 24.01.2020 00:31

Mathematics, 24.01.2020 00:31

Health, 24.01.2020 00:31


