

Mathematics, 27.02.2020 02:29, swaggg2084
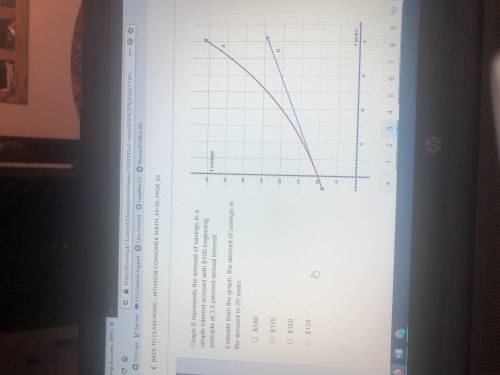
Graph B represents the amount of savings in a simple interest account with $100 beginning principle at 3.5% annual interest.
Estimate from the graph the amount of savings in the account in 20 years
A-$180
B-$170
C-$160
D-$150

Answers: 1


Other questions on the subject: Mathematics
Mathematics, 21.06.2019 20:50, brea2006
An automobile assembly line operation has a scheduled mean completion time, μ, of 12 minutes. the standard deviation of completion times is 1.6 minutes. it is claimed that, under new management, the mean completion time has decreased. to test this claim, a random sample of 33 completion times under new management was taken. the sample had a mean of 11.2 minutes. assume that the population is normally distributed. can we support, at the 0.05 level of significance, the claim that the mean completion time has decreased under new management? assume that the standard deviation of completion times has not changed.
Answers: 3
Mathematics, 21.06.2019 23:00, emiliestinnett
Peter measures the angles in a triangle. he finds that the angles are 95, 10 and 75. is he correct? explain your answer
Answers: 2
Mathematics, 22.06.2019 00:10, juliapreciiado
Hello, i need compare km^2 and km. what's difference in this?
Answers: 2
Do you know the correct answer?
Graph B represents the amount of savings in a simple interest account with $100 beginning principle...
Questions in other subjects:

History, 05.01.2021 17:20

Arts, 05.01.2021 17:20
Mathematics, 05.01.2021 17:20

History, 05.01.2021 17:20

Business, 05.01.2021 17:20
History, 05.01.2021 17:20
History, 05.01.2021 17:20
Mathematics, 05.01.2021 17:20


