

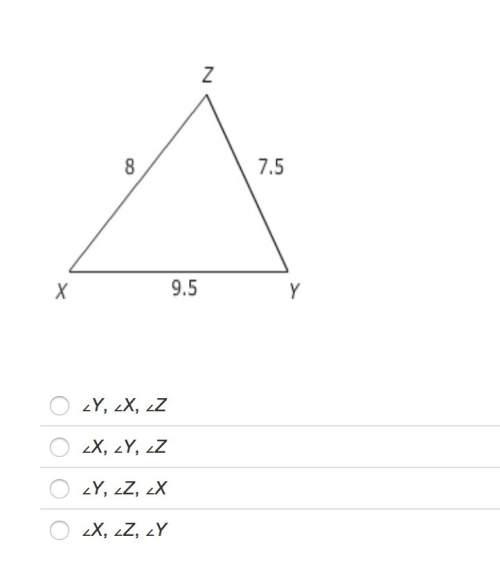


PLEASE ANSWER
Mrs. Mallory and Mrs. Bodine collected data on the science and math final...

Mathematics, 26.02.2020 19:26, areanna02
PLEASE ANSWER
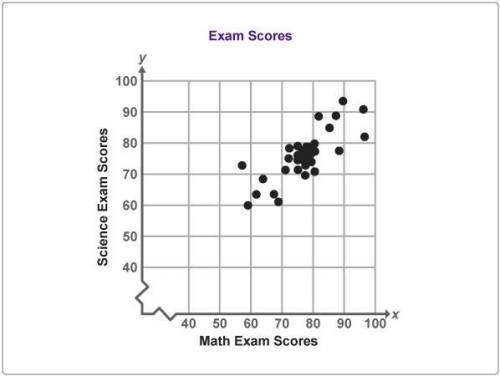
Mrs. Mallory and Mrs. Bodine collected data on the science and math final exam scores for a group of students.
What is the best explanation for the cluster of students shown on the graph?
A. No students scored above 90 on both exams.
B. One student scored exactly 60 on both exams.
C. All the students scored between 60 and 100 on both exams.
D. More than half the students scored between 70 and 80 on both exams.

Answers: 1
Other questions on the subject: Mathematics
Mathematics, 21.06.2019 17:30, nurmukhammada
Can someone me with this problem i don't understand i need
Answers: 2
Mathematics, 22.06.2019 02:00, saeedalr366
Your company will replace the asphalt roofs on all the buildings at the factory complex shown below. the buildings have flat roofs. you charge according to the total roof area. what is this area, in square yards?
Answers: 3
Do you know the correct answer?
Questions in other subjects:
Mathematics, 22.10.2020 08:01

Mathematics, 22.10.2020 08:01

History, 22.10.2020 08:01

Advanced Placement (AP), 22.10.2020 08:01

History, 22.10.2020 08:01


