


PLEASE ANSWER
Alisha made a scatter plot that compares the number of minutes the members...

Mathematics, 26.02.2020 19:15, chantihock05
PLEASE ANSWER
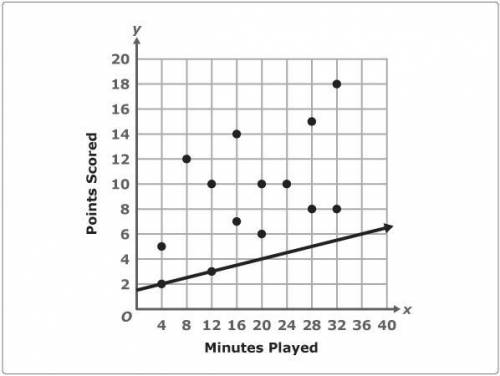
Alisha made a scatter plot that compares the number of minutes the members of the basketball team played to the points each scored during a game. She drew a line of best fit as shown.
Is the line Alisha drew a correct line of best fit? Explain why or why not.

Answers: 2
Other questions on the subject: Mathematics
Mathematics, 21.06.2019 18:00, bravomichelle75
Aschool puts on a play. the play costs $1,200 in expenses. the students charge $4.00 for tickets. there will be one performance of the play in an auditorium that seats 500 people. what is the domain of the function that shows the profit as a function of the number of tickets sold?
Answers: 2
Mathematics, 21.06.2019 19:30, Animallover100
Write the sine and cosine values of a, b, respectively, in the figure for (1) and (2) + explanation.
Answers: 1
Do you know the correct answer?
Questions in other subjects:


History, 22.05.2020 04:58

Biology, 22.05.2020 04:58
Mathematics, 22.05.2020 04:58
Mathematics, 22.05.2020 04:58
History, 22.05.2020 04:58
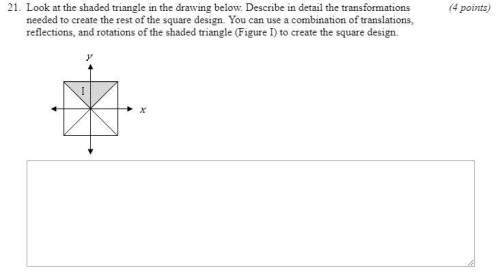
Mathematics, 22.05.2020 04:58


