

Mathematics, 26.02.2020 11:50, morgannwaldrupp
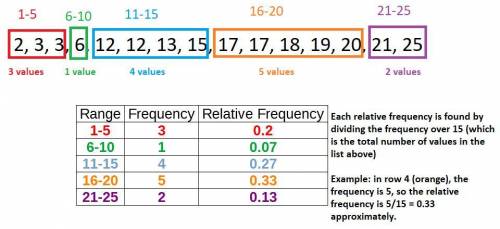
Generate a frequency table for the following data: 3, 12, 25, 2, 3, 6, 17, 17, 15, 13, 20, 12, 21, 18, 19.
Use the ranges listed in the table below:
Range Number of Values Relative Frequency
1 – 5
6 – 10
11 – 15
16 – 20
21 – 25
What is the relative frequency for the range 21 – 25?
A) 0.04
B) 4
C) 0.13
D) 0.33

Answers: 3


Other questions on the subject: Mathematics
Mathematics, 21.06.2019 15:30, mathman783
Which polynomial function has x intercepts -1, 0, and 2 and passes through the point (1, -6)
Answers: 2
Mathematics, 21.06.2019 22:20, macycj8
1. 2. ∠b and ∠y are right angles. 3.? 4.? which two statements are missing in steps 3 and 4? ∠x ≅ ∠c △abc ~ △zyx by the sas similarity theorem. ∠b ≅ ∠y △abc ~ △zyx by the sas similarity theorem. = 2 △abc ~ △zyx by the sss similarity theorem. = 2 △abc ~ △zyx by the sss similarity theorem.
Answers: 2
Mathematics, 22.06.2019 02:30, misk980
Atrain traveled for 1.5 hours to the first station, stopped for 30 minutes, then traveled for 4 hours to the final station where it stopped for 1 hour. the total distance traveled is a function of time. which graph most accurately represents this scenario? a graph is shown with the x-axis labeled time (in hours) and the y-axis labeled total distance (in miles). the line begins at the origin and moves upward for 1.5 hours. the line then continues upward at a slow rate until 2 hours. from 2 to 6 hours, the line continues quickly upward. from 6 to 7 hours, it moves downward until it touches the x-axis a graph is shown with the axis labeled time (in hours) and the y axis labeled total distance (in miles). a line is shown beginning at the origin. the line moves upward until 1.5 hours, then is a horizontal line until 2 hours. the line moves quickly upward again until 6 hours, and then is horizontal until 7 hours a graph is shown with the axis labeled time (in hours) and the y-axis labeled total distance (in miles). the line begins at the y-axis where y equals 125. it is horizontal until 1.5 hours, then moves downward until 2 hours where it touches the x-axis. the line moves upward until 6 hours and then moves downward until 7 hours where it touches the x-axis a graph is shown with the axis labeled time (in hours) and the y-axis labeled total distance (in miles). the line begins at y equals 125 and is horizontal for 1.5 hours. the line moves downward until 2 hours, then back up until 5.5 hours. the line is horizontal from 5.5 to 7 hours
Answers: 1
Mathematics, 22.06.2019 03:20, DarkKings799
What is the volume of a cardboard box that measures 1 inch by 5 inches by 7 inches? the volume of the cardboard is cubic inches. enter your answer as the number that correctly fills in the blank in the previous sentence. if necessary, round your answer to the nearest tenth, like this: 42.5
Answers: 1
Do you know the correct answer?
Generate a frequency table for the following data: 3, 12, 25, 2, 3, 6, 17, 17, 15, 13, 20, 12, 21, 1...
Questions in other subjects:
Mathematics, 21.04.2021 16:10
Mathematics, 21.04.2021 16:10

Health, 21.04.2021 16:10


Mathematics, 21.04.2021 16:10


