


A frequency table for the 30 best lifetime baseball
batting averages of all time is shown to t...

Mathematics, 26.02.2020 04:40, kookycookiefanx
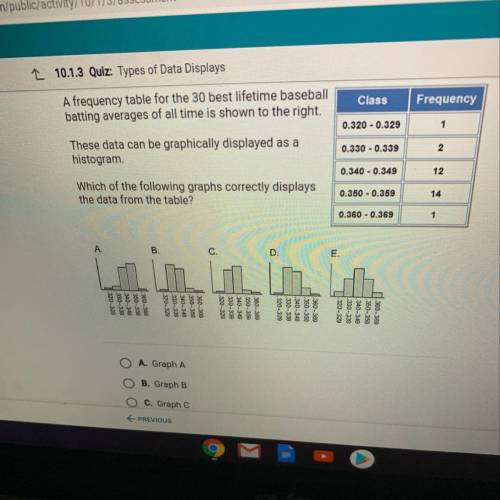
A frequency table for the 30 best lifetime baseball
batting averages of all time is shown to the right.
These data can be graphically displayed as a
histogram.
Which of the following graphs correctly displays
the data from the table?

Answers: 2
Other questions on the subject: Mathematics
Mathematics, 21.06.2019 14:00, lujaynsparkles
Which solid has two triangular bases and three lateral faces, each in the shape of a rectangle? triangular prism triangular pyramid rectangular prism rectangular pyramid
Answers: 3
Mathematics, 21.06.2019 14:30, sierram298
The multiplication property of zero states that the product of any number and 0 is 0. what must be true about either a or b to make ab=0
Answers: 1
Do you know the correct answer?
Questions in other subjects:

Mathematics, 10.05.2021 15:50
Mathematics, 10.05.2021 15:50

Mathematics, 10.05.2021 15:50

English, 10.05.2021 15:50

Chemistry, 10.05.2021 15:50


