
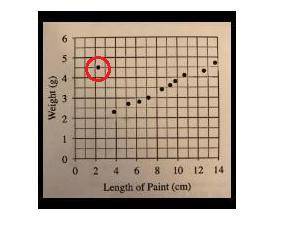


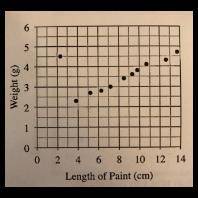
CIRCLE the outlier in the scatter plot below.
(Draw a picture)
...

Mathematics, 24.02.2020 17:46, kdamaso93
CIRCLE the outlier in the scatter plot below.
(Draw a picture)

Answers: 1
Other questions on the subject: Mathematics
Mathematics, 21.06.2019 18:30, angelina6836
Anormally distributed data set has a mean of 176.3 and a standard deviation of 4.2. what is the approximate z-score for the data value of 167.9? 2.00 −2.00 8.4 −8.4
Answers: 2
Mathematics, 21.06.2019 21:30, cdvazquez727
The box plots show the average speeds, in miles per hour, for the race cars in two different races. which correctly describes the consistency of the speeds of the cars in the two races?
Answers: 3
Do you know the correct answer?
Questions in other subjects:

Physics, 30.12.2020 14:00


English, 30.12.2020 14:00
Mathematics, 30.12.2020 14:00
English, 30.12.2020 14:00


Health, 30.12.2020 14:00


