


Select the correct answer from each drop-down menu.
Which inequality is represented by the gra...

Mathematics, 24.02.2020 05:06, sammybrain
Select the correct answer from each drop-down menu.
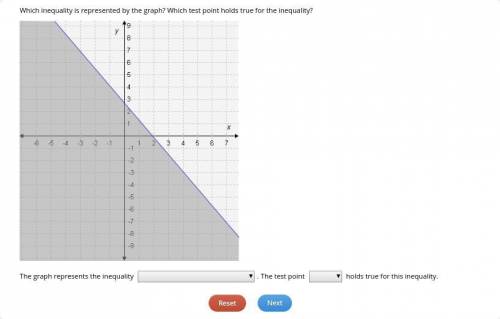
Which inequality is represented by the graph? Which test point holds true for the inequality?
1st drop down: 1. x + 3y is less than or equal to 8, 2. 4x + 3y is greater than or equal to 8, 3. 4x + 3y is less than or equal to 8, 4. 4x + 3y is less than or equal to 12.
2nd drop down: 1. (-1, 4), 2. (0, 3), 3. (1, 4), 4. (2, 1/3).
The graph represents the inequality . The test point holds true for this inequality.

Answers: 2
Other questions on the subject: Mathematics
Mathematics, 21.06.2019 15:00, aubreystechschu11331
Ahigh school has 3636 players on the football team. the summary of the players' weights is given in the box plot. approximately, what is the percentage of players weighing less than or equal to 225225 pounds?
Answers: 2
Mathematics, 21.06.2019 16:30, Hfruit
You drop a rubber ball off the roof of a 50 meter high building onto a paved parking lot. it bounces back up with every bounce, but not quite all the way back up to you. after the first bounce it bounces back only 80 percent of the distance it was dropped from. the pattern continues, meaning after every bounce it comes up to just 80 percent of the previous maximum height. so if before the first bounce the height is 50 meters, what height does the ball reach after the fifth bounce? round your answer to one decimal place and chose the correct response from the choices below:
Answers: 1
Mathematics, 21.06.2019 17:00, beautycutieforever10
Evaluate the expression for the given value of the variable. 5×(h+3) for h=7
Answers: 1
Do you know the correct answer?
Questions in other subjects:
Mathematics, 05.12.2020 22:20

Biology, 05.12.2020 22:20


Arts, 05.12.2020 22:20


