

Mathematics, 23.02.2020 09:48, KieraKimball
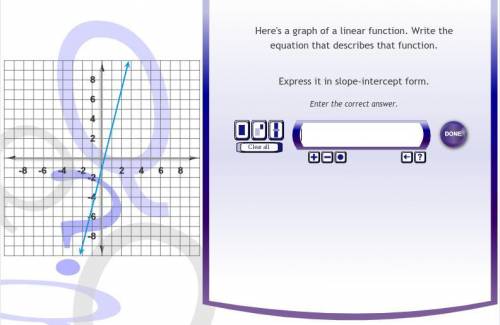
Here's a graph of a linear function. Write the equation that describes that function. (If blurry zoom in.)
(Express it in slope-intercept form.)

Answers: 2


Other questions on the subject: Mathematics
Mathematics, 21.06.2019 15:40, helper4282
The number of lattes sold daily for two coffee shops is shown in the table: lattes 12 52 57 33 51 15 46 45 based on the data, what is the difference between the median of the data, including the possible outlier(s) and excluding the possible outlier(s)? 48.5 23 8.4 3
Answers: 3
Mathematics, 21.06.2019 16:00, kell22wolf
Part one: measurements 1. measure your own height and arm span (from finger-tip to finger-tip) in inches. you will likely need some from a parent, guardian, or sibling to get accurate measurements. record your measurements on the "data record" document. use the "data record" to you complete part two of this project. name relationship to student x height in inches y arm span in inches archie dad 72 72 ginelle mom 65 66 sarah sister 64 65 meleah sister 66 3/4 67 rachel sister 53 1/2 53 emily auntie 66 1/2 66 hannah myself 66 1/2 69 part two: representation of data with plots 1. using graphing software of your choice, create a scatter plot of your data. predict the line of best fit, and sketch it on your graph. part three: the line of best fit include your scatter plot and the answers to the following questions in your word processing document 1. 1. which variable did you plot on the x-axis, and which variable did you plot on the y-axis? explain why you assigned the variables in that way. 2. write the equation of the line of best fit using the slope-intercept formula $y = mx + b$. show all your work, including the points used to determine the slope and how the equation was determined. 3. what does the slope of the line represent within the context of your graph? what does the y-intercept represent? 5. use the line of best fit to you to describe the data correlation.
Answers: 2
Mathematics, 21.06.2019 16:30, chmereaustin1
An empty bucket is placed under a faucet dripping at a constant rate of 4 milliliters per minute. with the given information, which of these statements is a reasonable conclusion? a there will be 24 milliliters of water in the bucket after 16 hour. b there will be 60 milliliters of water in the bucket after 14 hour. c there will be 160 milliliters of water in the bucket after 20 minutes. d there will be 100 milliliters of water in the bucket after 40 minutes.
Answers: 1
Do you know the correct answer?
Here's a graph of a linear function. Write the equation that describes that function. (If blurry zoo...
Questions in other subjects:


Geography, 16.09.2019 23:10

Biology, 16.09.2019 23:10
Biology, 16.09.2019 23:10
Geography, 16.09.2019 23:10

Mathematics, 16.09.2019 23:10


