

Mathematics, 22.02.2020 05:27, 200002977
During the period from 1790 to 1930, the US population P(t) (t in years) grew from 3.9 million to 123.2 million. Throughout this period, P(t) remained close to the solution of the initial value problem.
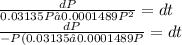
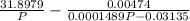
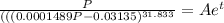
(dP/dt)= 0.03135P – 0.0001489P^2 , P(0) = 3.9
(a) What 1930 population does this logistic equation predict?
(b) What limiting population does it predict?
Ps: I have answered this question and got a result, hence, I'm just checking my work, so please provide a detailed answer. THANKS

Answers: 2


Other questions on the subject: Mathematics
Mathematics, 21.06.2019 15:10, wanderlay29
Which system of linear inequalities is graphed? can somebody please
Answers: 3
Mathematics, 21.06.2019 21:00, newsome1996p4ggft
5x−4≥12 or 12x+5≤−4 can you with this problem
Answers: 3
Mathematics, 21.06.2019 23:30, sindy35111
Atown has a population of 17000 and grows at 2.5% every year. to the nearest year, how long will it be until the population will reach 19600?
Answers: 1
Do you know the correct answer?
During the period from 1790 to 1930, the US population P(t) (t in years) grew from 3.9 million to 12...
Questions in other subjects:


Mathematics, 22.08.2019 14:10


