

Mathematics, 22.02.2020 00:21, aminamuhammad11
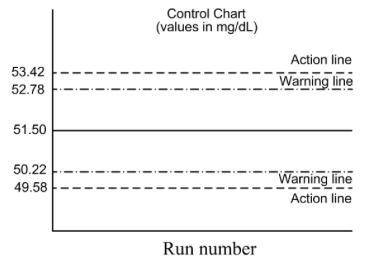
A control chart is developed to monitor the analysis of iron levels in human blood. The lines on the control chart were obtained from a control sample with a population mean, μ, of 51.50 mg/dL and a population standard deviation, σ, of 3.50 mg/dL.
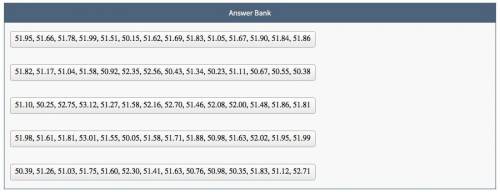
To monitor the analysis of the iron levels, the laboratory measured 30 replicate control samples every day. Lists of the mean values of the 30 replicate control samples measured every day over a series of 14 consecutive days (runs) are given.
Classify the lists of mean values based on whether they indicate the process should be shut down for troubleshooting or not.

Answers: 1


Other questions on the subject: Mathematics
Mathematics, 21.06.2019 17:00, beautycutieforever10
Evaluate the expression for the given value of the variable. 5×(h+3) for h=7
Answers: 1
Mathematics, 21.06.2019 20:00, aliahauyon20
The rectangle shown has a perimeter of 108 cm and the given area. its length is 6 more than five times its width. write and solve a system of equations to find the dimensions of the rectangle.
Answers: 3
Mathematics, 21.06.2019 21:30, lewisf5929
Vanessa earns a base salary of $400.00 every week with an additional5% commission on everything she sells. vanessa sold $1650.00 worth of items last week.
Answers: 2
Do you know the correct answer?
A control chart is developed to monitor the analysis of iron levels in human blood. The lines on the...
Questions in other subjects:

Mathematics, 14.07.2019 06:30


Social Studies, 14.07.2019 06:30
Mathematics, 14.07.2019 06:30


