

Mathematics, 21.02.2020 17:45, stussy44
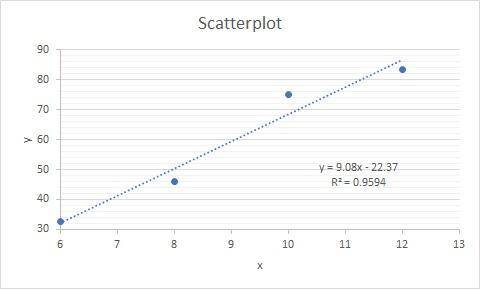
Researchers asked each child in a sample of 411 school-age children if they were more or less likely to purchase a lottery ticket at a store if lottery tickets were visible on the counter. The percentage that said that they were more likely to purchase a ticket by grade level are as follows (R&J Child Development Consultants, Quebec, 2001):
Grade Percentage That Said They
Were More Likely to Purchase
6 32.7
8 46.1
10 75.0
12 83.6
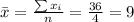
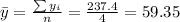
a. Construct a scatterplot of y = percentage who said
they were more likely to purchase and x = grade. Does
there appear to be a linear relationship between x and y?
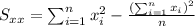
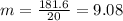
b. Find the equation of the least-squares line

Answers: 2


Other questions on the subject: Mathematics
Mathematics, 21.06.2019 15:00, Bgreene2377
Given the choice between receiving $1.000.000 in one month or a single penny-doubled everyday for the period of one month; which option would you choice? show your work to support your answer. (assume that 1 month=30 days)
Answers: 1
Mathematics, 21.06.2019 19:20, mrskhg3395
Based on the diagram, match the trigonometric ratios with the corresponding ratios of the sides of the triangle. tiles : cosb sinb tanb sincposs matches: c/b b/a b/c c/a
Answers: 2
Mathematics, 21.06.2019 20:30, amauris77748
There are 45 questions on your math exam. you answered 810 of them correctly. how many questions did you answer correctly?
Answers: 3
Do you know the correct answer?
Researchers asked each child in a sample of 411 school-age children if they were more or less likely...
Questions in other subjects:


Health, 23.12.2019 21:31
Biology, 23.12.2019 21:31
English, 23.12.2019 21:31


