

![r=\frac{5(162)-(30)(25)}{\sqrt{[5(206) -(30)^2][5(155) -(25)^2]}}=0.42967](/tpl/images/0518/6210/3bd7c.png)


![r=\frac{n(\sum xy)-(\sum x)(\sum y)}{\sqrt{[n\sum x^2 -(\sum x)^2][n\sum y^2 -(\sum y)^2]}}](/tpl/images/0518/6210/ec454.png)

 , and then the final conclusion would be:
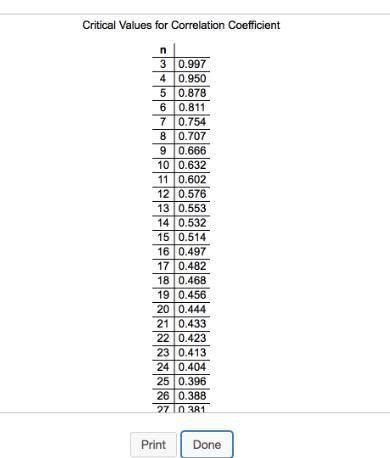


(a) For the accompanying data set, draw a scatter diagram of the data.
x 2 6 6 7 9
y 3 2...

Mathematics, 21.02.2020 02:31, evazquez
(a) For the accompanying data set, draw a scatter diagram of the data.
x 2 6 6 7 9
y 3 2 6 9 5
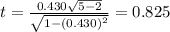
(b) by hand compute the correlation coefficient. r = (round to three decimals as needed.)
(c) Fill in the blanks: Because the correlation coefficient is (positive or negative) and the absolute value of the correlation coefficient, , is (greater or not greater) than the critical value for this data set,___, (no, a positive, or a negative) linear relation exists between x and y.

Answers: 3
Other questions on the subject: Mathematics
Mathematics, 21.06.2019 16:40, cthompson1107
The table shows the total distance that myra runs over different time periods. which describes myra’s distance as time increases? increasing decreasing zero constant
Answers: 2
Mathematics, 21.06.2019 19:30, HockeyBlockpk7039
Hardest math question of all time can you solve the equation. check for extraneous solutions.9∣9-8x∣ = 2x+3
Answers: 2
Mathematics, 21.06.2019 21:30, elicollierec
What does independent variable and dependent variable mean in math?
Answers: 2
Do you know the correct answer?
Questions in other subjects:

History, 02.03.2021 01:20
Mathematics, 02.03.2021 01:20
Mathematics, 02.03.2021 01:20
Mathematics, 02.03.2021 01:20

Mathematics, 02.03.2021 01:20
Mathematics, 02.03.2021 01:20
English, 02.03.2021 01:30
Mathematics, 02.03.2021 01:30


