


HELP HELP PLEASE
geoff surveys the students in his class to find out if they prefer Dipp...

Mathematics, 21.02.2020 00:13, joel4676
HELP HELP PLEASE
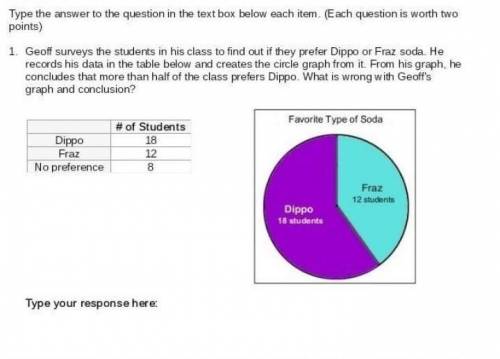
geoff surveys the students in his class to find out if they prefer Dippo or fraz soda. He reports his data in the table balow and creates the circle graph from it. from his graph he concludes that more than half of the class prefers dippo. What is wrong with geoffs graph and conclusions

Answers: 3
Other questions on the subject: Mathematics
Mathematics, 21.06.2019 18:50, abbieT6943
Find the greatest common factor of the followig monomials 21u^5v,3u^4v^6, and 3u^2v^5
Answers: 1
Mathematics, 21.06.2019 20:00, Chen5968
The distribution of the amount of money spent by students for textbooks in a semester is approximately normal in shape with a mean of $235 and a standard deviation of $20. according to the standard deviation rule, how much did almost all (99.7%) of the students spend on textbooks in a semester?
Answers: 2
Mathematics, 21.06.2019 21:30, bella122805
Awater truck is filling a swimming pool. the equation that represents this relationship is y=19.75x where y is the number of gallons of water in the pool and x is the number of minutes the truck has been filling the pool.
Answers: 1
Do you know the correct answer?
Questions in other subjects:

History, 24.07.2019 08:20


