

Mathematics, 20.02.2020 22:51, ozzy1146
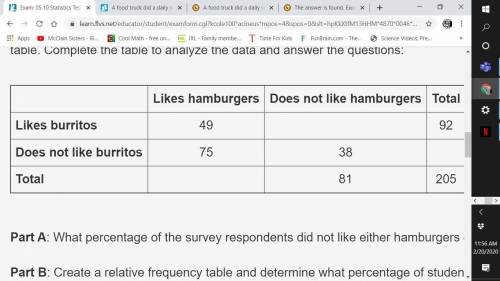
A food truck did a daily survey of customers to find their food preferences. The data is partially entered in the frequency table. Complete the table to analyze the data and answer the questions:
the graph is the picture
Part A: What percentage of the survey respondents did not like either hamburgers or burritos? (2 points)
Part B: Create a relative frequency table and determine what percentage of students who like hamburgers also like burritos. (3 points)
Part C: Use the conditional relative frequencies to determine which two data point has strongest association of its two factors. Use complete sentences to explain your answer. (5 points)

Answers: 2


Other questions on the subject: Mathematics
Mathematics, 21.06.2019 17:30, tnassan5715
What is the shape of the height and weight distribution
Answers: 2
Mathematics, 21.06.2019 20:50, peachijmin
These tables represent a quadratic function with a vertex at (0, -1). what is the average rate of change for the interval from x = 9 to x = 10?
Answers: 2
Mathematics, 22.06.2019 02:00, pgjohnston001
Pls what is the relative minimum of the function? enter your answer in the box
Answers: 3
Do you know the correct answer?
A food truck did a daily survey of customers to find their food preferences. The data is partially e...
Questions in other subjects:


