


(image attatched!)
A food truck did a daily survey of customers to find their food prefer...

Mathematics, 20.02.2020 08:17, hernandezbrandon059
(image attatched!)
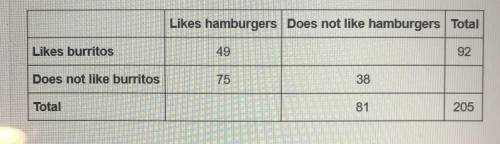
A food truck did a daily survey of customers to find their food preferences. The data is partially entered in the frequency table. Complete the table to analyze the data and answer the questions:
Likes hamburgers Does not like hamburgers
Likes hamburgers
Does not like hamburgers
Total
Likes burritos
49
92
Does not like burritos
75
38
Total
81
205
Part A: What percentage of the survey respondents did not like either hamburgers or burritos? (2 points)
Part B: Create a relative frequency table and determine what percentage of students who like hamburgers also like burritos. (3 points)
Part C: Use the conditional relative frequencies to determine which two data point has strongest association of its two factors. Use complete sentences to explain your answer. (5 points)

Answers: 1
Other questions on the subject: Mathematics
Mathematics, 21.06.2019 18:00, Kellystar27
Someone this asap for a group of students attends a basketball game. * the group buys x hot dogs at the concession stand for $2 each. * the group buys y drinks at the concession stand for $3 each. the group buys 29 items at the concession stand for a total of $70. how many hot dogs did the group buy?
Answers: 1
Mathematics, 21.06.2019 23:00, fatimababy
700 miles the train takes 5 hours to a travel the distance at what unit rate is the train traveling?
Answers: 1
Do you know the correct answer?
Questions in other subjects:


History, 21.08.2019 18:20
English, 21.08.2019 18:20


