

Mathematics, 20.02.2020 07:46, 0prayforthelost0
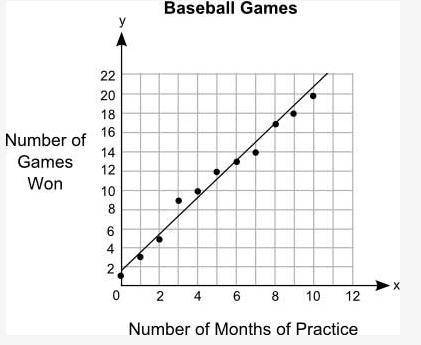
The graph shows the relationship between the number of months different students practiced baseball and the number of games they won: (look at image attached)
Part A: What is the approximate y-intercept of the line of best fit and what does it represent? (5 points)
Part B: Write the equation for the line of best fit in slope-intercept form and use it to predict the number of games that could be won after 13 months of practice. Show your work and include the points used to calculate the slope. (5 points)

Answers: 3


Other questions on the subject: Mathematics
Mathematics, 21.06.2019 22:30, garcser257278
If a and −a are numbers on the number line, which expression must give the distance between them? a) 0 b) a c) |2a| d) |a|
Answers: 1
Do you know the correct answer?
The graph shows the relationship between the number of months different students practiced baseball...
Questions in other subjects:


Chemistry, 27.04.2020 01:29
English, 27.04.2020 01:29

Social Studies, 27.04.2020 01:29
Mathematics, 27.04.2020 01:29


