

Mathematics, 20.02.2020 04:52, briannalv0814
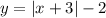
The graph of y = StartAbsoluteValue x EndAbsoluteValue is transformed as shown in the graph below. Which equation represents the transformed function?
On a coordinate plane, an absolute value function is shown. The vertex of the function is at (negative 3, negative 2). It crosses the x-axis at (negative 5, 0) and (negative 1, 0) and it crosses the y-axis at (0, 1).
y = StartAbsoluteValue x minus 3 EndAbsoluteValue + 2
y = StartAbsoluteValue x + 3 EndAbsoluteValue minus 2
y = StartAbsoluteValue x minus 2 EndAbsoluteValue + 3
y = StartAbsoluteValue x + 2 EndAbsoluteValue minus 3

Answers: 2
 g(-5) = |-5 + 3} - 2 = 2 - 2 = 0 ⇒ (-5,0)

Other questions on the subject: Mathematics
Mathematics, 21.06.2019 21:00, natjojo0512
Rewrite the following quadratic functions in intercept or factored form. show your work. f(x) = 3x^2 - 12
Answers: 1
Mathematics, 21.06.2019 23:00, abbymoses3
Someone answer this asap for the function f(x) and g(x) are both quadratic functions. f(x) = x² + 2x + 5 g(x) = x² + 2x - 1 which statement best describes the graph of g(x) compared to the graph of f(x)? a. the graph of g(x) is the graph of f(x) shifted down 1 units. b. the graph of g(x) is the graph of f(x) shifted down 6 units. c. the graph of g(x) is the graph of f(x) shifted to the right 1 unit. d. the graph of g(x) is the graph of f(x) shifted tothe right 6 units.
Answers: 3
Do you know the correct answer?
The graph of y = StartAbsoluteValue x EndAbsoluteValue is transformed as shown in the graph below. W...
Questions in other subjects:
Mathematics, 08.10.2020 14:01
Mathematics, 08.10.2020 14:01
Mathematics, 08.10.2020 14:01


Biology, 08.10.2020 14:01
Mathematics, 08.10.2020 14:01


