

Mathematics, 20.02.2020 00:15, Arm2005
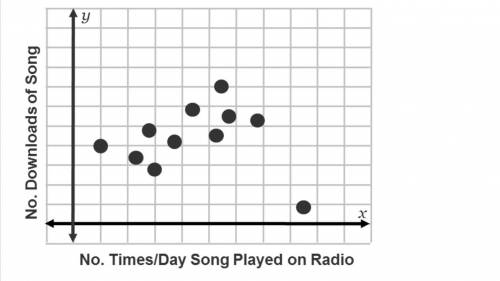
The graph shows the number of Internet downloads of a song compared to the number of times it is played on the radio.
What can you conclude from the data? Check all that apply.
A)The number of times a song is played on the radio affects its number of downloads.
B)Increased radio play affects the download demand for all songs equally.
C)Even though there was very high radio play, the downloads of one song remained very low.
D)In general, increased radio play does not affect the number of downloads.

Answers: 1


Other questions on the subject: Mathematics
Mathematics, 22.06.2019 02:00, dilaydi1212
Given that s is the centroid of triangle mno, find sq.
Answers: 1
Mathematics, 22.06.2019 02:00, shelbyann5502
Landon drove 103.5 miles on tuesday 320.75 miles on wednesday and 186.30 miles on thursday for work his company pays 0.07 $ for each mile he drives he expects to be paid more than $40,000 is he correct explain
Answers: 3
Do you know the correct answer?
The graph shows the number of Internet downloads of a song compared to the number of times it is pla...
Questions in other subjects:


English, 18.03.2020 17:32

Mathematics, 18.03.2020 17:32


