


WILL MARK BRAINLEST
The table shows a probability distribution for predicting how many...

Mathematics, 19.02.2020 00:47, magics
WILL MARK BRAINLEST
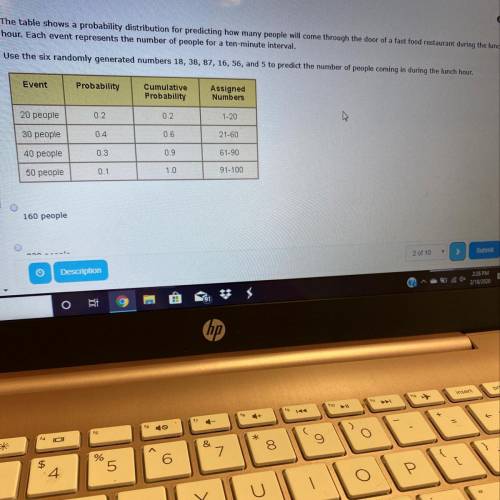
The table shows a probability distribution for predicting how many people will come through the door of a fast food restaurant during the lunch
hour. Each event represents the number of people for a ten-minute interval.
Use the six randomly generated numbers 18, 38, 87, 16, 56, and 5 to predict the number of people coming in during the lunch hour.
Event
Probability
Cumulative
Probability
Assigned
Numbers
20 people
0.2
0.2
30 people
0.4
40 people
0.3
50 people

Answers: 1
Other questions on the subject: Mathematics
Mathematics, 21.06.2019 18:00, ijustneedhelp29
What does the relationship between the mean and median reveal about the shape of the data
Answers: 1
Do you know the correct answer?
Questions in other subjects:

Mathematics, 17.07.2019 22:30


Mathematics, 17.07.2019 22:30


