

Mathematics, 16.02.2020 03:22, ddrain6285
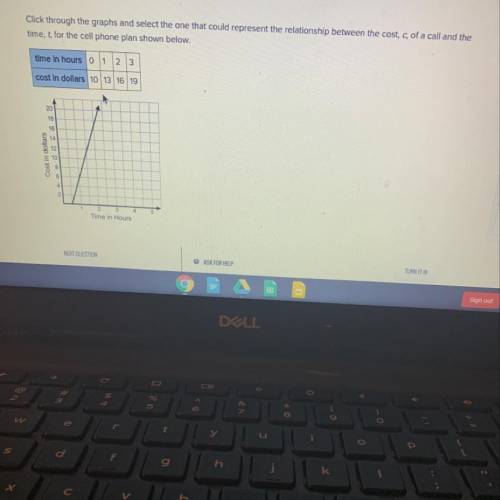
Click through the graphs and select the one that could represent the relationship between the cost, c, of a call and the
time, t, for the cell phone plan shown below.
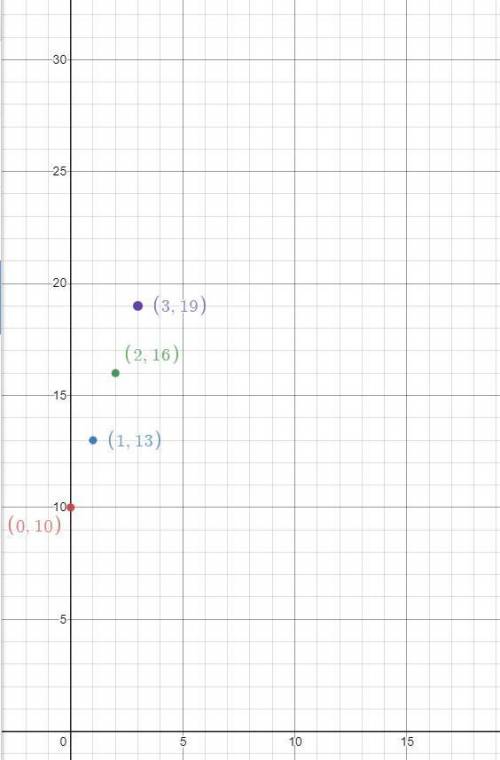
time in hours 0 1 2 3
cost in dollars 10 13 16 19

Answers: 3


Other questions on the subject: Mathematics
Mathematics, 21.06.2019 17:00, themajesty9898
Twice the sum of a number and 4 is equal to three times the difference of the number and 7. find the number.
Answers: 1
Mathematics, 21.06.2019 20:30, Mgarcia325
Justin has 750 more than eva and eva has 12 less than justin together they have a total of 63 how much money did
Answers: 1
Mathematics, 21.06.2019 21:30, swordnewsnetwork
Which of the following disjunctions is true? 4 + 4 = 16 or 6 - 5 = 11 4 · 3 = 7 or 3 - 2 = 5 8 - 5 = 13 or 7 · 2 = 12 7 - 4 = 11 or 6 + 3 = 9
Answers: 1
Mathematics, 21.06.2019 22:30, lekepius3715
Given the system of equations presented here: 2x + 4y = 14 4x + y = 20 which of the following actions creates an equivalent system such that, when combined with the other equation, one of the variables is eliminated? multiply the second equation by â’4 to get â’16x â’ 4y = â’80 multiply the second equation by â’1 to get â’4x â’ y = â’20 multiply the first equation by 2 to get 4x + 8y = 28 multiply the first equation by â’1 to get â’2x â’ 4y = â’14
Answers: 1
Do you know the correct answer?
Click through the graphs and select the one that could represent the relationship between the cost,...
Questions in other subjects:

Mathematics, 20.02.2021 23:10

Mathematics, 20.02.2021 23:20
Mathematics, 20.02.2021 23:20


English, 20.02.2021 23:20


