


y=−23x+1

Mathematics, 14.02.2020 20:57, awesome267
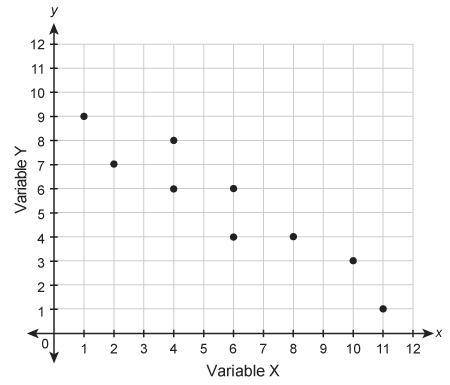
Which equation could represent the relationship shown in the scatter plot?
y=−23x+1
y=9x−12
y=−34x+10
y=−3x−2
Scatter plot with x axis labeled variable x and y axis labeled variable y. Points go from upper left to lower right.

Answers: 2
Other questions on the subject: Mathematics
Mathematics, 21.06.2019 23:30, bhopainting
Simplify (8x2 − 1 + 2x3) − (7x3 − 3x2 + 1). −5x3 + 11x2 − 2 5x3 − 11x2 + 2 x3 + 2x2 + x3 x3 − 2x2 − x3
Answers: 1
Mathematics, 22.06.2019 03:40, NorbxrtThaG
Abottled water distributor wants to estimate the amount of water contained in 1-gallon bottles purchased from a nationally known water bottling company. the water bottling company’s specifications state that the standard deviation of the amount of water is equal to 0.02 gallon. a random sample of 50 bottles is selected, and the sample mean amount of water per 1-gallon bottle is 0.995 gallon a. construct a 99% confidence interval estimate for the popula-tion mean amount of water included in a 1-gallon bottle. b. on the basis of these results, do you think that the distributor has a right to complain to the water bottling company? why? c. must you assume that the population amount of water per bottle is normally distributed here? explain. d. construct a 95% confidence interval estimate. how does this change your answer to (b)?
Answers: 2
Do you know the correct answer?
Which equation could represent the relationship shown in the scatter plot?
y=−23x+1
y=−23x+1
Questions in other subjects:


Mathematics, 26.02.2020 05:54


