

Mathematics, 14.02.2020 04:13, echavarrianoah
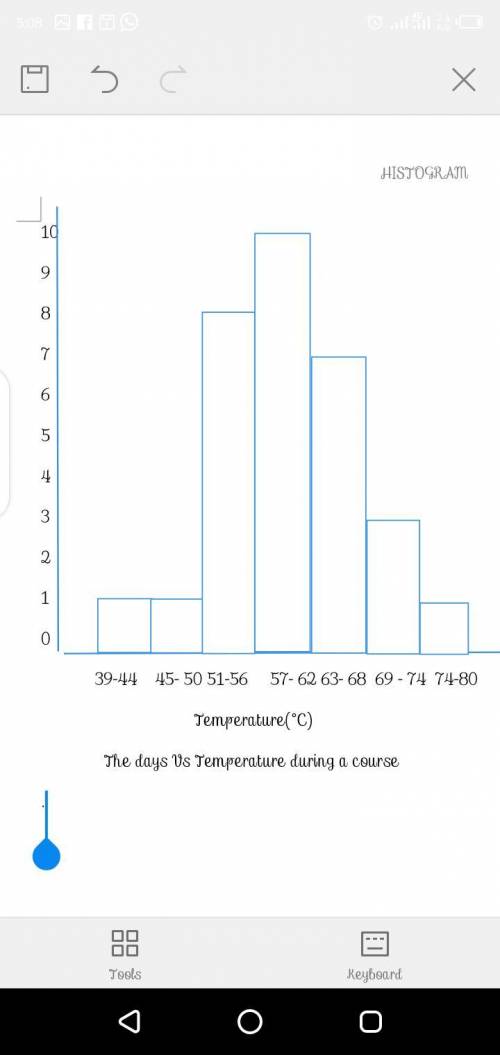
The frequency distribution below represents frequencies of actual low temperatures recorded during the course of a 31-day month. Use the frequency distribution to construct a histogram. Do the data appear to have a distribution that is approximately normal?
Class Frequency
A 39 minus 44 1
B 45 minus 50 1
C 51 minus 56 8
D 57 minus 62 10
E 63 minus 68 7
F 69 minus 74 3
G 75 minus 80 1

Answers: 3


Other questions on the subject: Mathematics
Mathematics, 21.06.2019 15:20, alaina3792
Which equation represents a circle with a center at (–3, –5) and a radius of 6 units? (x – 3)2 + (y – 5)2 = 6 (x – 3)2 + (y – 5)2 = 36 (x + 3)2 + (y + 5)2 = 6 (x + 3)2 + (y + 5)2 = 36
Answers: 3
Mathematics, 21.06.2019 16:00, jamiecoolgal8697
Question: what is the value of x 4x-2= (-7) +5x. it would be greatly appreciated if someone could actually explain to me step by step
Answers: 2
Mathematics, 21.06.2019 17:00, aminamuhammad11
Suppose i flip two identical coins. what is the probability that i get one head and one tail?
Answers: 2
Do you know the correct answer?
The frequency distribution below represents frequencies of actual low temperatures recorded during t...
Questions in other subjects:


Chemistry, 24.04.2021 08:30
Mathematics, 24.04.2021 08:30

Spanish, 24.04.2021 08:30


